
The VIX Fear and Volatility Index – what it is, how to justify it and how to predict it.
VIX index – what is it
The VIX index is an indicator that reflects the
volatility of the economy . Otherwise, it is called an indicator of investor sentiment. High values of the VIX index indicate the corresponding fears of players in the stock markets, while low values, on the contrary, signal a satisfactory condition of depositors.

What is the CBOE Volatility Index
The CBOE volatility index is an indicator that reflects expectations in the securities market. It changes depending on the latest changes in the
S&P 500 index, the main index of the United States economy. The volatility forecast for the last 30 days is taken into account. Such temporary restrictions are due to the fact that the expiration dates on the SPX index are taken into account.

Understanding the VIX indicator
The VIX chart reflects the expectations of depositors over the next 365 days. Deviations and inconsistencies are also taken into account, for example, for the S&P 500 index. The main deviation is the movement in the value of assets that falls under the 68 percent range. Let’s consider a simple example. If the VIX chart reads 15 today, the number is equal to a percentage of the present value of the S&P being equal to the previously discussed range.

How VIX is calculated
You need to start with the fact that the index in question is not ordinary securities, but options. That is, an investor can trade stocks or bonds at a predetermined price in the future. An increase in the value of options occurs at a time when the market is in decline or constantly fluctuating in both directions. Growth does not always occur, but most of the time, so some investors consider options a good insurance to protect their assets. The biggest gains occur when securities succumb to deep volatility.
How the VIX can predict the future
The stock market may offer to buy not only securities at a predetermined price, but also options on the S & P 500 index. The number in the title indicates the number of America’s largest companies that are practically not regulated by the state – they are private. Specialists compiling indexes take into account the actual cost of options for the last month. The behavior of the S&P 500 can be used to calculate future volatility by analyzing both entry and exit.
What does a low score mean?
The VIX index is able to reflect both the degree of fear and potentially the mood of investors. This happens by analyzing the expected volatility. The higher the considered indicator, the more panic and anxiety in the market, and a low indicator indicates the opposite – the calmness and satisfaction of investors.

How to trade VIX
VIX cannot be bought directly, but no one forbids investors from trading in the options in question. It is enough to open a position in the relevant market, both options and futures are suitable. Trading is the preferred way for both investors and traders. Using this tool, you can hedge an existing portfolio, as well as earn on a change in the value of the index, if a sharp decline in assets in the portfolio is expected in the near future. The VIX Fear and Volatility Index can be viewed online at: https://www.google.com/finance/quote/VIX:INDEXCBOE?sa=X&ved=2ahUKEwjyz6qymvP5AhUv_7sIHS8kARIQ3ecFegQIHxAg

How to make money on VIX
In 2008, when the global economic crisis occurred, the interest of players in the stock markets to earn money on fluctuations in the securities market increased significantly. This was the forerunner of betting on changes in the value of assets. The result of the events of 2008 is new markets and products that allow you to invest in the VIX index. This can be done using
ETFs and ETNs.
- Some investors use the considered tools for short-term income on speculative actions – index changes.
- The rest hedge – insure existing assets on the exchanges during a decrease in value for some reason. The result of such manipulations will be compensation for drawdowns, since the corresponding index will grow.

Trading strategy that can be used
There are many trading strategies based on the VIX. Let’s consider one of the most effective and safe — trading on ETN. The abbreviation may resemble a classical instrument, but this is not entirely true. As already mentioned, the downward trend of the VIX is fixed at a time of low volatility and high stability in the stock market. However, it grows during times of uncertainty and fear of players, including unreasonable asset volatility. The essence of the strategy is to evaluate the current indicators, as well as historical data, which will allow a more objective assessment of the market. In addition, the above strategy can be used in conjunction with other technical indicators. They can be useful, for example, to evaluate the completion of transactions by time. In order to conduct technical research,
Bollinger band and nine-period simple
moving average .
- The Bollinger Band is a tool that displays volatility and allows you to track the period of an expected price change. In the strategy under consideration, it can be used as an indicator of recovery to the average.
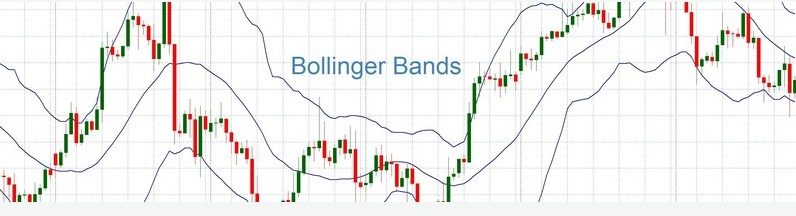
- A two-band moving average will help refine your entries.

It is worth saying that this strategy can be used for both long-term investments and short-term ones. The entry, according to the strategy, will be carried out during the period of a one-time fulfillment of the conditions. Consider an example of conditions for long positions:
- VIX is in a downward trend;
- the VIX index falls to the Bollinger band at the bottom, and preferably lower;
- the nine-period moving average is below the value of the index used;
- entry is carried out at a cost that exceeds the nine-period moving;
- place an exchange order with a stop loss that is lower than the recent fluctuations of the VIX index;
- you can close the position when the index crosses the Bollinger band from above.
If you use the above instructions in reverse, you will get the conditions by which you can enter short positions. Consider a chart that reflects the situation on the stock market and analyze the above strategy.


How Investors Lose Money on the VIX
In times of crisis, investors who are interested in the long-term process of investing and holding assets can watch the VIX index rise sharply. As a result, the portfolio is replenished with appropriate options, which should compensate for losses in the long term. This approach seems very logical, but the stock market can recover without sharp changes in asset values. This situation will lead to a fall in the price of the index of fear and volatility, which will entail significant losses for the investor. It is also worth noting that ETF assets tend to burn out. That is, such assets cannot be stored in the long term. For example, if you look at almost any fund that allows you to invest in a fear and volatility index, you can see a systematic downward trend in the value of such an asset. The main reason for this is the need to acquire new and sell old futures on the S&P index. So the assets included in a certain fund will imitate the VIX chart and its movement depending on the stability of the assets. Usually, all contracts are kept at the declared indicator for about 1 month. Their cost varies depending on their term – the shorter the term, the cheaper the contract and vice versa. The fund is required to sell some futures contracts on a daily basis and then acquire others. For example, if the first futures has a term of 15 days, then it will cost less, and if 30 or more, then it will be correspondingly more expensive. That is, the fund buys futures at a higher price and sells them much cheaper. This brings losses to investors. If you buy options on the VIX index, then you can play it safe in times of long-term downturns in the market or in the event of a sharp increase in volatility. Speculation with the instrument is very risky, so it is better to limit yourself to a short-term perspective of use.


