Fundamental analysis of the stock market – basics, indicators, tools, methods of fundamental analysis of company shares, securities, financial markets Fundamental analysis – fundamental analysis, this term refers to the methodology for creating forecasts of the market (stock exchange) estimated value of companies, which is based on the analysis of its indicators. This type of analysis is used by traders in order to objectively assess the potential of the enterprise (including the value of its shares). As a result of the analysis, the trader can evaluate the financial capabilities of the company, such as:
- the company’s total revenue;
- net profit received by the company;
- the total net worth of the company;
- liabilities of the company, its debit and credit debt;
- the amount of money flowing through the company;
- the amount of dividends paid by the company;
- company performance indicators.

Example:
As an example, consider the purchase of complex household appliances, such as a TV. One of the buyers will simply purchase the first device that is more or less suitable in terms of price and design.
Another will carefully consider several options before making a purchase. He will select the most convenient and reliable model, study customer reviews, compare technical specifications, and only after a detailed study will he begin to compare prices and look for the most advantageous combination of price and quality. Such a choice in terms of parameters will be a fundamental analysis before buying a TV .
- Fundamental analysis of financial markets – how it works
- Fundamental and technical analysis – the main differences
- Fundamental analysis: goals and objectives
- Methods used in fundamental analysis
- Comparison Method in Fundamental Analysis of Financial Markets
- Seasonal Analysis
- Deductive and inductive methods of analysis
- Correlation technique
- Grouping and generalization technique
- Fundamental analysis – system and structure
- Stages of fundamental analysis
- Analysis of the economic situation
- Analysis of companies and individual sectors of the economy
- Analysis of the value of shares and other securities
- Main sources of data for fundamental analysis
- News and financial analytics
- Rates of Central Banks of countries
- Economic calendar
- Reports of companies on the results of financial and economic activities
- Indicators that are taken into account in fundamental analysis
- Macroeconomic indicators
- The most popular indicators (multipliers) used for fundamental analysis
- Leading indicators
- lagging indicators
- Matching indicators
Fundamental analysis of financial markets – how it works
Fundamental market analysis is based primarily on the fact that the real value of a company’s assets can differ significantly from the market value.
In this case, there is a possibility that the markets may misvalue – overvalue or undervalue companies’ assets in the short term. Adherents of fundamental analysis are firmly convinced that, despite the incorrect assessment of the value of assets, it always returns to the correct (objective) price.
Example:
As an example, consider the performance of Tesla stock. Despite the significant, in the short term, and speculative decline in the share price associated with information stuffing and a shortage of microchips.
In the long term, its securities not only return their high value, but also show steady growth, and the company constantly increases its level of capitalization.Therefore, the main purpose of applying the fundamental analysis mechanism is to determine the true value of assets and compare it with the current market price. Such a comparison enables the trader to confidently predict the change in the value of assets and thus opens up financial opportunities. Such an analysis is practically useless for short-term investments, however, with long-term investments, it is he who will most accurately predict the behavior of an asset on the market.
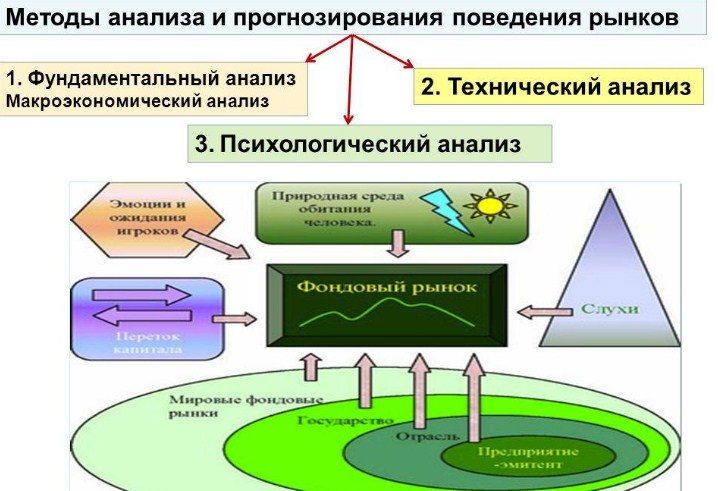
Fundamental and technical analysis – the main differences
The main differences between phenomenal and technical analysis are the parameters that are analyzed. So if fundamental analysis considers, first of all, the internal state of assets and practically does not consider the state of the current price of assets in the market. That technical analysis, on the contrary, basically considers and analyzes just the current price dynamics, which allows you to use it with great success when planning short-term investments.
Arguing about “which is better” fundamental or technical analysis is unreasonable. Each of them is used to determine its own criteria, and if fundamental analysis is practically useless for short-term investments and helps a lot with long-term investments, then technical analysis is the opposite.
That technical analysis is designed just to work with short-term investments.

Fundamental analysis: goals and objectives
In order to successfully use the analysis for forecasts in the field of investment, it is necessary, first of all, to determine the goals and objectives that are set during the analysis. The purpose of the analysis is to prepare the investor for a possible change in the value of assets. Understanding the cause-and-effect relationships that cause price fluctuations, and such causes are usually external. Such events include:
- geopolitical, social and economic phenomena;
- general market sentiment, prospects for economic development in relation to a particular country;
- natural and man-made disasters, abnormal environmental conditions, the occurrence of which caused significant economic damage;
- internal and external instability (civil conflicts, revolutions, rebellions, coups, external and internal wars in and around the state);
- internal political events (parliamentary and presidential elections, referendums, change of ruling elites, etc.);
- disclosure (publication) of economic indicators for relevant countries or industries.
Methods used in fundamental analysis
When conducting fundamental analysis, the following methods are used:
Comparison Method in Fundamental Analysis of Financial Markets
This method is based on a comparison of economic indicators that are published and yet to be expected. The stronger the differences between these indicators, the more violent the reaction of the players on the stock exchange will be. And accordingly, this can lead to a massive closing or opening of transactions in the most profitable directions, which obviously follow from such differences.
Seasonal Analysis
The factor of seasonal fluctuations of the stock market affects the assets located on it. So in the case of shares, not only the quarterly financial and economic statements of the company are important, but also the number of shares that were sold on the market in season or out of season. Companies operating in different sectors of the economy receive different revenues in different periods of time. This, accordingly, cannot but affect dividend payments,
volatilityand liquidity of shares. At the same time, comparison of sales figures by companies is usually carried out not only by the indicators of the previous quarter, but also by the indicators of the same quarter of the last year. A similar analysis is done by national agencies on the country’s macroeconomic indicators. In addition, to work with macroeconomic indicators, the methods of “eliminating seasonality” are used, with their help, data are adjusted. This allows you to clearly understand how they differ from the norm for this quarter, month, year. In addition, there are separate periods on the exchanges during which, as a rule, there is a massive closing of certain positions by investors (such periods include the eve of the Christmas holidays). Such periods are necessarily taken into account when analyzing stock markets. Indeed, in a low-volatility market, such a closure can lead to a very sharp change in securities quotes. Of course, seasonal analysis alone is not enough to make a decision to buy or sell assets, but it is a necessary element when conducting general fundamental research. This method is used when analyzing not only the stock market. It is also widely used when making decisions on the purchase and sale of assets in the foreign exchange, commodity and other markets.
As an example, consider a situation where a prolonged rainy season suddenly dragged on. This can lead to the loss of part of the crop from the cotton plantations, which will reduce the amount of available goods and in turn lead to an increase in prices for it. Thus, by tracking seasonality and conducting analysis, it is possible to predict a sharp change in prices for cotton futures.
Deductive and inductive methods of analysis
Using induction, the investor processes the indicators of various indicators and news, and on their basis builds assumptions about possible price changes in the markets. Deduction is mainly used for trend trading and is most often included in the fundamental analysis of stocks. The essence of this method is to build conclusions – from general to particular. This is a rather complicated technique that can give erroneous results due to the excessive confidence of the person who conducted the analysis in their conclusions. However, deduction can be invaluable in situations where, for example, it is necessary to understand what to do with EURUSD in case of increased fluctuations in European markets.
Correlation technique
This technique is a combination formed at the intersection of technical and fundamental analysis. Its essence lies in the fact that, with the growth of one of the assets, the value of another asset associated with it (or associated assets) can either increase or decrease. Today, exchanges use corresponding indicators to account for correlation, such as Indcor-Correlation or OverLay Chart.

Grouping and generalization technique
This technique belongs to complex, professional-level techniques and is mainly used by analysts. It consists in breaking down assets into groups in accordance with their “behavior” in the market, and after that a generalized index is calculated on them. This technique is used to analyze markets by major players and analytical companies, but experienced investors can create their own macroeconomic indicator. Such indicators, for example, include the Dow Jones index, compiled on the basis of fundamental analysis for the 30 largest companies classified as “blue chips”. Fundamental market analysis (company shares, currencies, cryptocurrencies): what is it, basics, multipliers, types and methods of analysis: https://youtu.be/fa1xkn7OfZY
Fundamental analysis – system and structure
A trader, making a decision to invest, must first of all answer a number of questions:
- on which assets he plans to trade;
- what currencies are included in the pair (if he plans to work in the currency markets);
- which companies are included in the corresponding securities index (when planning operations in the stock markets);
- the planned time frame for the conclusion of transactions?

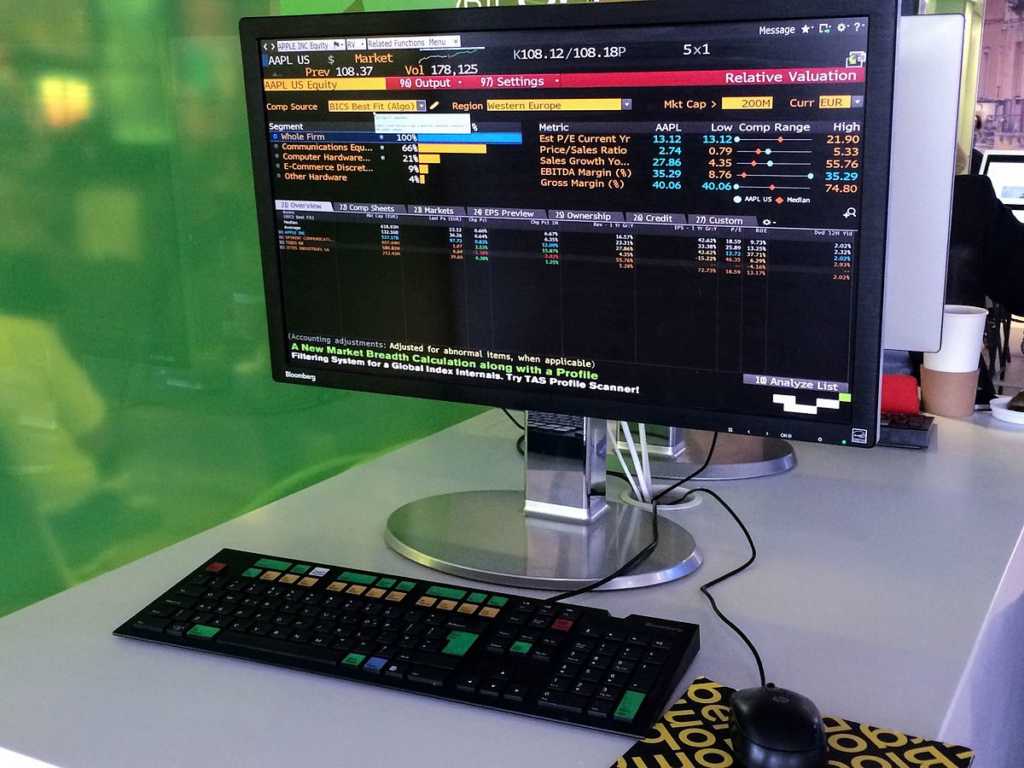
Stages of fundamental analysis
Fundamental analysis can be divided into several stages:
Analysis of the economic situation
Such an analysis usually begins with an understanding of the general situation in the market. For example, take the EUR/USD currency pair. There is always quite a lot of news on the European and American currency markets on all information platforms. And maintaining strong volatility in currency pairs and stocks in these markets is not difficult. Moreover, such a pair is suitable for almost all trading styles, including
swing and
scalping .. If a trader decides to open a deal on EUR/USD, then, first of all, he should pay attention to the decisions in the field of monetary policy that were made by the Fed and the ECB. The governing bodies of both these organizations meet every 6 weeks. At such meetings, they decide on changes in interest rates and make their judgments in various areas of the economy. Based on these decisions, and comparing them with the previous ones, it is possible to draw certain conclusions and develop analytical forecasts in various areas, which is often what professional analysts do.
Analysis of companies and individual sectors of the economy
This stage of the fundamental analysis of the stock market includes the study of the activities of the companies chosen by the investor. To do this, you need to start closely monitoring corporate news and events in the industry where the company conducts its core business.
To analyze the securities market, first of all, indices are used, such as the Industrial Average,
S&P500 , Dow Jones, Nikkei225 and others. These indices are formed on the basis of the activities of the largest and most stable companies that operate in a particular region.
At the same time, in order to more or less accurately determine which of the industries are currently dominant in the market, it is also necessary to monitor and analyze the change in the rates of the indices themselves. Before starting trading operations, a trader needs to check the dividend calendar, it is easy to determine the beginning and end of corporate reporting seasons. The dividend calendar also publishes a large amount of data that affects the value of assets and the quote of indices.
Analysis of the value of shares and other securities
This aspect of the fundamental analysis of the stock market considers the financial performance of the company, including the growth (decrease) in total and operating income, etc. If over a long period of time, despite external factors, there is a trend towards a stable growth of capitalization, then this means high stability and profitability of the company’s shares in the long term. Despite the fact that in the short term (day, week, month), the value of the company’s shares may fluctuate both upward and downward.

Main sources of data for fundamental analysis
To conduct fundamental analysis, investors and financial analysts usually use such sources of data as:
News and financial analytics
First of all, investors should decide which events and in which market they will track. So in the foreign exchange market, any significant news from the United States will affect the dollar, and hence the exchange rates of almost all currencies. In the same way, important events in the life of the Tesla company will affect the quotes of shares and other securities on the stock market. The same applies to stock indices, so before starting a fundamental analysis, an investor should clearly define in which of the market segments he wants to invest. After that, it is necessary to study exactly the information related to the particular sector that was chosen by him.
Rates of Central Banks of countries
When conducting fundamental analysis, it is also necessary to focus on the bulletins of the Central Banks of countries, especially the ECB and the FRS in the field of monetary policy and interest rates on loans. Markets react very dynamically to almost any change in expectations, and information about changes in interest rates or monetary policy can have a very strong impact on market configuration. This is especially true of the Fed (Federal Reserve System), which controls the reserve currency and any of its decisions are reflected not only in the US market, but also in almost all other markets.
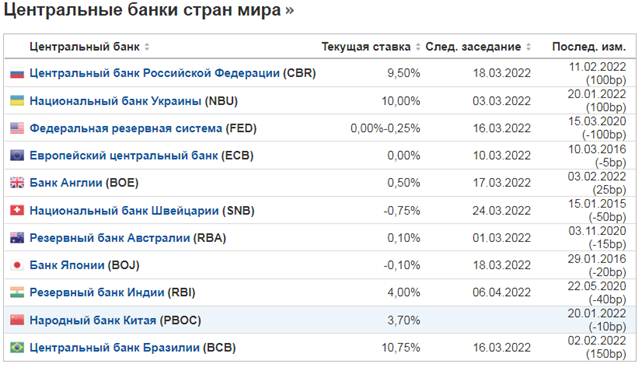
Central banks of the leading countries of the world:
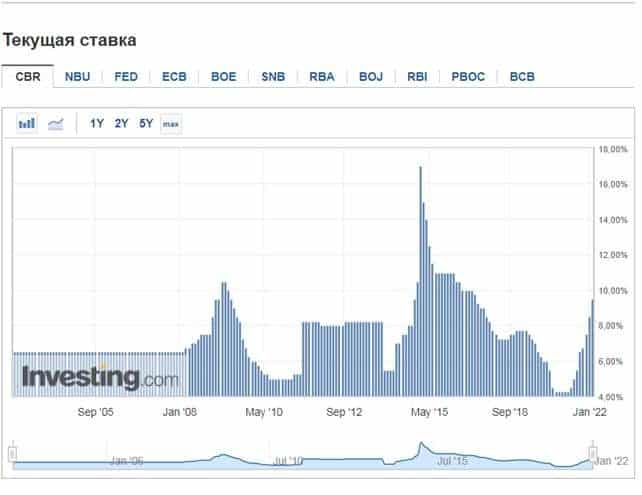
Dynamics of changes in the current rate of the Central Bank of the Russian Federation for the current time
Economic calendar
One of the most important sources of obtaining the necessary for fundamental analysis is the Economic calendar. It reflects in a visual form almost all the trends of the modern economy, and from which you can draw almost all the necessary data for analysis.
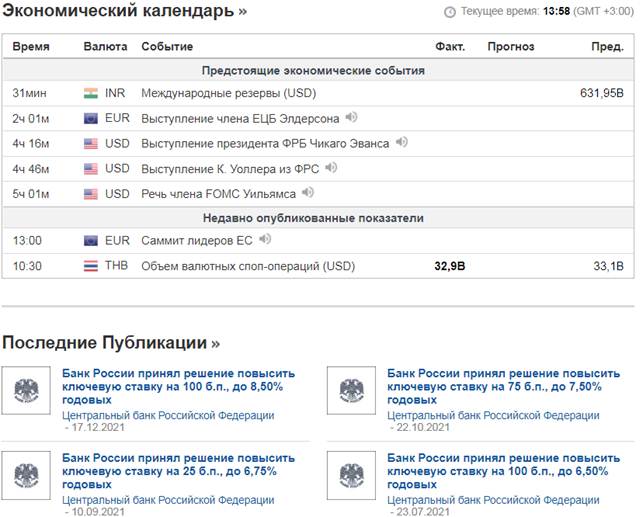
Reports of companies on the results of financial and economic activities
Studying the reports of accounting and financial statements of companies allows you to determine its parameters related to the profitability of capitalization and other parameters that are necessary for a comprehensive fundamental analysis. Based on them, conclusions can be drawn about the prospects for the development of the company, its stability (and, accordingly, the stability of its securities)
Indicators that are taken into account in fundamental analysis
These indicators include:
Macroeconomic indicators
The most important macroeconomic indicators that are under the icon of three stars in the calendars are:
- decision on the interest rate of the Central Bank;
- NFP (Non-Farm Payrolls)
- unemployment index;
- consumer price index;
- GDP (Gross Domestic Product).
The most popular indicators (multipliers) used for fundamental analysis
Fundamental analysis: stock multiples, how to find undervalued stocks: https://youtu.be/PgMgKY2Y5U4
Leading indicators
These types of indicators are needed in order to make a competent forecast about possible future changes in the economies of countries. Changes in these indicators indicate possible positive or negative changes, which, one way or another, will affect all (or many market sectors). These indicators make it possible to predict, when conducting a fundamental analysis, for example, a recession, and they are widely used in the work of analysts and heads of the Central Bank’s central bodies to determine the vector of development and adjust the monetary policy of the Central Bank. Practically similar criteria are used by investors to build or adjust their strategies in the market. These types of indicators include:
- The volume of receipt of state. permits for capital construction. The greater the number of permits issued, the better the prospects for the construction industry and other related industries.
An increase in this indicator indicates the prospects for a decrease in unemployment, improvement in mortgage lending conditions, etc.
- The Consumer Confidence Index shows the willingness of citizens to spend their money.
On its basis, the situation in the field of employment of the population and the state of the economy of the state are determined.
- The volume of applications for unemployment benefits. The indicator shows the growth (decrease) of unemployment in a certain period, which is naturally reflected in the level of GDP, the collection of taxes on the cost of purchases, and so on.
lagging indicators
These indicators reflect the changes that have already taken place in the country’s economy and their dynamics over time. These indicators include:
- Unemployment rate . It indicates the actual number of unemployed in the country at a given time.
- Consumer Price Index . Showing the dynamics of changes in the cost of the consumer basket for a certain period of time
- Trade balance . The ratio of the value of imported and exported goods in the country for a certain period of time
Investors use these indicators in their analysis to confirm the trends that are firmly established in the market.
Matching indicators
This type of indicator is used when conducting fundamental analysis to obtain information about the current economic state of the country, which allows investors to create a detailed diagram of current market trends. Among them:
- Average income is an indicator of the sum of all incomes of an individual, regardless of the source.
- Retail sales – shows changes in the volume of retail sales of goods.
- GDP is the value of all goods and services produced in a country over a given period of time.
The factors that are necessarily taken into account and used in fundamental analysis also include force majeure (“events that are force majeure circumstances and which cannot be influenced at a given time”). These include:
- Wars, internal and external military conflicts.
- Man-made disasters and natural disasters.
- Political instability, riots, riots, revolutions and other force majeure events.
Example
Examples of force majeure include the coronavirus pandemic. Which during 2019-2021 significantly changed the state of the market. So the shares of travel companies sank to almost historic lows due to border closures, and only now there has been a very slight increase. At the same time, shares of pharmaceutical companies and companies producing personal biological protection equipment and medical equipment have risen sharply, and their growth continues despite the lifting of
COVID restrictions by some countries.Fundamental analysis is based on GDP, inflation and interest rates, these three economic indicators, like no other, can affect the market. Therefore, when conducting an analysis, they should be given special, increased attention.

Thiruthani Hous
Varanbarappilly po
Veapur
680303
Thrussr
PAN card number
DSXPA6708R
Aadhar card numbe
628353681297