
The main indicators of technical analysis in trading and their use on the exchange – an encyclopedia of technical indicators, trending, oscillating. Many traders prefer to build forecasts based on fundamental indicators, which are not always reflected in the value of an asset. And technical indicators provide a comprehensive set of objective data that allows you to navigate the market situation and predict price dynamics.
What are technical indicators in trading
A technical indicator is a rigorous mathematical model that is built on the basis of objective market information and is used to predict trends. By its nature, it is a function of price and is expressed in a graphical format. The tool takes into account historical data on the value of the asset, the number of completed and open transactions. Through programmed heuristic formulas or patterns, the indicator generates signals about potential market changes. This information is used by traders to confirm or refute their own forecasts. 
Classification of technical analysis indicators
Today, many technical indicators have been developed, which are classified into 2 main groups: leading and lagging. Algorithms of the first type take into account the rate of price change in real time and generate signals about a likely change in the economic cycle or the general trend. In contrast, technical analysis lagging indicators look at historical data and are used to confirm or deny a price event, such as a strengthening trend. Depending on the method of calculating forecast indicators, indicators are divided into 2 categories:
- Technical analysis trend indicators used to identify a trend and determine its strength. Most of them belong to the class of lagging indicators, because implement the principle of price smoothing. When using them, it is necessary to assess the market situation in advance and determine whether a trend has formed. In a flat market, technical analysis trend indicators give false signals and encourage traders to make losing trades.
- Oscillating (ranking) , used to detect market conditions of oversold or overbought assets. Most of them belong to the class of leading indicators. They are most effective when there is no pronounced trend in the market.


How to use indicators
Technical indicators in trading have 3 main uses:
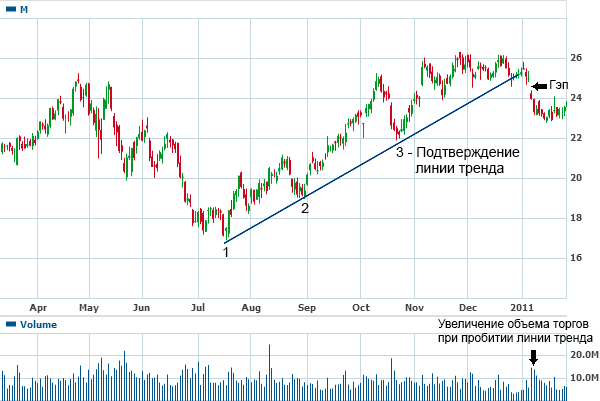
- notify about the breakout of support and resistance lines ;
- confirm the signals of other technical analysis tools, for example, chart patterns;
- help predict future prices.
Technical indicators are applicable to any type of financial instruments that are accompanied by historical objective data. However, they are more commonly used in the commodity and currency markets, where traders focus primarily on assessing short-term price changes. Investors often combine several indicators of technical analysis. There is no best combination of tools, each trader builds his own effective system. To increase the accuracy of forecasts, technical indicators are combined with more subjective tools, such as chart patterns. They are also included in automated trading systems, given their quantitative nature.
Pros and cons of indicators
Although technical analysis is never seen as the sole or main tool for making forecasts, it has a number of important advantages:
- reflect current market sentiment;
- provide objective data for analysis (prices and volumes);
- allow you to easily identify patterns, which makes it easier to make trading decisions;
- effective in predicting short-term trends.
While technical indicators are useful as forecasting aids, they have several significant drawbacks:
- They give mixed signals . As a rule, traders use several mathematical algorithms to improve the accuracy of their forecasts. But in combination, the indicators provide conflicting information, signaling the expediency of both buying and selling an asset. In this case, it is impossible to make an effective trading decision.
- Do not take into account fundamental indicators . Following only the signals of technical indicators, you cannot trade effectively. Instruments of this type do not reflect the change in economic cycles, changes in the global economy and politics, etc.
- Adapted only to certain market conditions . As a rule, indicators are developed for certain financial instruments or market situations. Therefore, any changes can affect the effectiveness of the signals.

Risks and Opportunities
The use of technical indicators comes with some risks, including:
- Misinterpretation of technical signals . There are several reasons for this: the neglect of the entire volume of objective indicators, the analysis of a small set of historical data, personal biases and persistent stereotypes.
- The probability of building forecasts ahead of time , since technical analysis is most effective in short-term trading. If you need to build a long-term forecast, you should combine the selected instruments with fundamental data.
- High probability of succumbing to emotions and losing capital . This is because technical analysis does not provide a deep understanding of market phenomena. When an investor makes a mistake, he starts to panic. This inevitably leads to collapse.
Technical analysis in combination with fundamental provides great opportunities for building highly accurate forecasts of the relative future price dynamics. It provides the investor with a comprehensive set of objective data that makes it easy to navigate the situation.
Best and Popular Technical Indicators
Today there are many subtypes of indicators depending on the type of information used in the analysis. The most popular include the following:
- Balance Volume Indicator , or OBV . As part of technical analysis, it is used to determine the strength of bulls and bears. The forecast is built on the basis of volume indicators, the change in which reflects the mood of the crowd. An increase in OBV means buyers are ready to make a deal. On the contrary, its decrease signals an increase in sales.
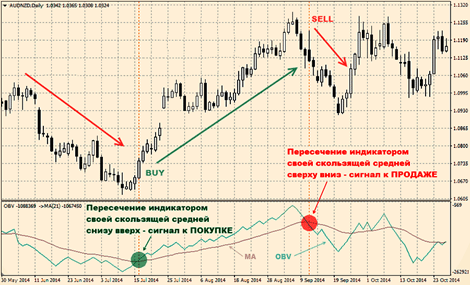
Using signals from the intersection of OBV and its moving average - Accumulation/Distribution Indicator, or A/D . It is widely used to confirm or refute the strength of the current trend. Forecasting is carried out on the basis of objective indicators of volume and value, which allow you to understand whether assets are accumulated or distributed over time. An ascending A/D line confirms an uptrend, while a descending line signals an intensification of a downtrend.
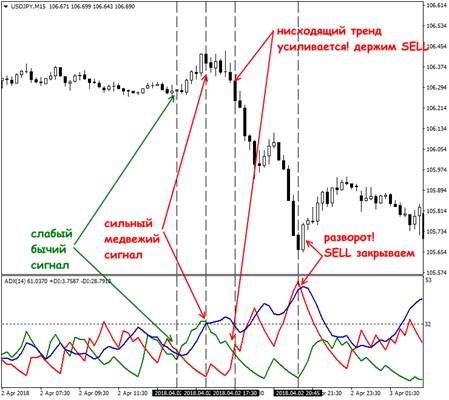
- Directional Movement Indicator, or ADX . It belongs to the category of trend tools and is used to measure the strength and momentum of a trend. Includes 3 lines: main ADX (central) and auxiliary +DI and -DI (located on the sides). An ADX value above 25 indicates a strong trend, below 20 indicates a weak one. The intersection of the +DI and -DI levels by the central line signals a potential trend reversal.
- Moving average convergence-divergence indicator, or MACD . Helps to determine the direction and momentum of a trend through the analysis of moving averages. Calculated by subtracting EMA (26) from EMA (12). The result of the calculation is EMA (9), which is commonly called the MACD signal line. The points where it crosses the EMA (26) and EMA (12) serve as potential triggers to buy or sell an asset.
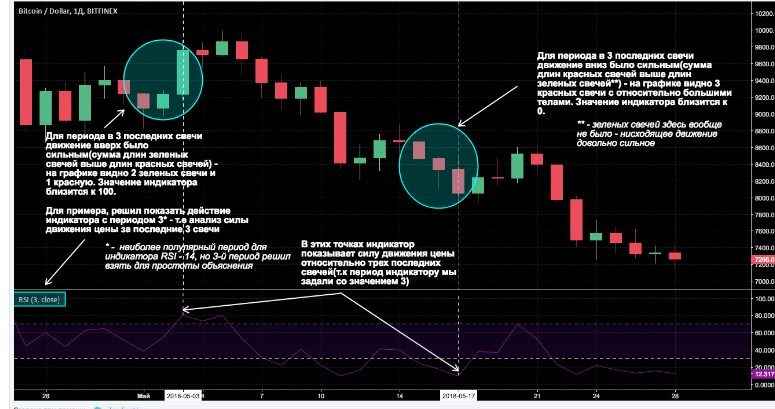
MACD indicator - Relative Strength Index, or RSI . This tool helps to determine the strength of the current trend and the likelihood of its reversal. In practice, it finds applications: it allows you to identify the state of overbought or oversold, to fix the strengthening or fading of the trend, to determine the levels of support and resistance. When forecasting, it compares the strength of an asset during periods of growth and decline.
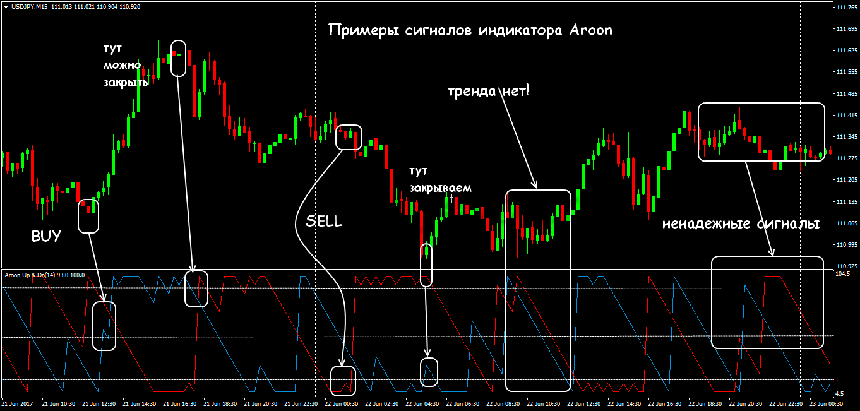
- Aroon indicator . Helps to determine the vector and strength of the trend by analyzing whether the price reaches new highs or lows for the calculation period. Under volatile market conditions, it often generates false trading signals.
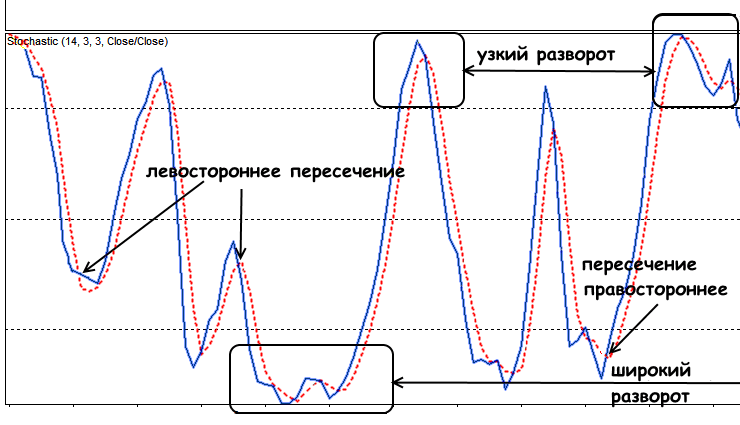
- The stochastic oscillator is the most popular indicator that signals an overbought or oversold condition of an asset. Assesses the position of the current price relative to the price range for the selected period, assigning it a percentage value from 0 to 100. It is believed that prices within an uptrend close near the high, and within a downtrend close near the low.
Stochastic Indicator


This is a basic set of technical analysis indicators used by experienced traders. Novice investors are encouraged to study and practice these tools in order to quickly and better understand the principles of the functioning of financial markets. However, one should not neglect other models, about which many books have been written. For example, R. Colby’s Encyclopedia of Technical Market Indicators is very informative and useful.
Application in practice
Before using indicators, a basic strategy must be defined. In other words, to design a system of objective and absolute rules of conduct when making trading decisions. The strategy should not be too simple or complex. For it to be viable, several universal questions must be answered:
- what type and what parameters of the indicator to choose;
- how many assets should be bought or sold;
- upon reaching what values it is necessary to open or close a position;
- how to hedge a trade;
- what are the rules of money management;
- what are the exit rules.
Top 5 technical analysis indicators for trading: https://youtu.be/1mCz-LZTbfM It is recommended to base your strategy on different types of indicators, such as momentum and trend. The use of similar tools leads to the distortion of information or the generation of false signals as a result of multiple calculations based on the same principle. https://articles.opexflow.com/analysis-methods-and-tools/osnovy-i-methody-texnicheskogo-trajdinga.htm The choice of indicators depends on the type of strategy and takes into account trading style and risk tolerance. A trader focused on long-term periods and profit maximization can follow the trend and use trend indicators (moving averages, ADX, etc.). Investors who are interested in making frequent small profits operate in highly volatile markets and use oscillators.


