During the evolution of technical analysis trading, many tools have emerged. But among the most simple, useful, safe and common indicators in trading, moving averages are distinguished. The following describes their necessity in trading and the features of using different types of moving averages in a trading strategy.
- What are moving averages in trading
- Main types of Moving Average and their description
- Practical application – algorithm how to use moving average
- Determination of a trend through moving
- moving average crossover
- Determination of resistance and support levels
- Three moving averages parallel to each other
- Formulas for calculating each type of moving averages
- SMA Formula
- EMA Calculation Formula
- SMMA Calculation Formula
- LWMA Calculation Formula
- Features of setting periods
- Moving averages for scalping
- Features of trading on moving averages, with examples
- Correct selection of the period for trading on a moving average
- Position of moving averages in the stock market
What are moving averages in trading
Moving Average, or as it is also called, Moving Average (MA) is a trading indicator that follows the price movement. Its purpose is to establish the direction of the trend and the possibility of its smoothing. When calculating the moving average, specialists choose to average the price of a certain instrument for a specific period.

However, false signals (sometimes in large numbers) are not ruled out.
If an excessively long period is applied, it is important to be aware that it can be dramatically delayed. For the same reason, the system will display outdated history. Large periods are often used for long-term support or resistance.
Main types of Moving Average and their description
There are 4 main types of MA indicator. In the implementation of the technical analysis of the investment market, a simple, exponential, smoothed and linearly weighted moving average is used.

- The Simple Moving Average is the sum of the closing prices of the selected instrument, which represents several periods. Moreover, this indicator is divided by the number of these periods. It is not by chance that the indicator was called simple, it is easy to use and is considered basic.
- Exponential Moving Average – in this case, a part of the actual closing price is added to the previous value of the moving average.
- The Linear Weighted Moving Average is the most active indicator of the family. This type can give a large number of false signals, but it is faster than others to identify changes in price. Traders rarely use this indicator.
- The Smoothed Moving Average is the smoothest among the others. SMMA provides a calculation method that, unlike SMA, also takes into account outdated values. By the way, in practice, the smoothed moving average is used very rarely.

Practical application – algorithm how to use moving average
The moving average is a trend indicator, in this regard, trading strategies based on it are quite relevant. There are 3 main ways to use signals:
- General direction . Represents the actual trend measures. It can be short, medium or long term. In this case, MA is directed upwards in an uptrend, and downwards in a downtrend. There is another mode – flat, when the moving average is horizontal.

- Crossing moving averages with different periods . The signal level always depends on the MA with the smallest period. If there is a crossing of the next line (from bottom to top), then a sign for the acquisition of an asset. Otherwise, it is a sell signal.
- Support and resistance . The intersection of the line is a kind of signal in the direction of the intersection itself. The indicator for a particular asset is completely different. It is recommended to remember this.


Determination of a trend through moving
The moving average shows the direction of the trend. In the event that the price indicator is located above the line, which is turned up, then the trend is upward. When 3 moving averages turn into parallel lines and “look” in a certain direction, then this is the strongest signal. At the same time, they should have different periods. If the price moves in a certain range on the market (not along one trajectory), then there is a possibility of a large number of extra signals.
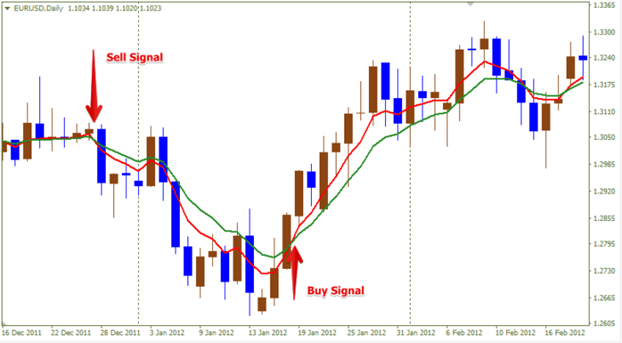
moving average crossover
When the fast moving average crosses the slow one, from the bottom up, a fairly strong signal to buy (Buy) is likely. If the situation is reversed (from top to bottom), then this is a signal to sell (Sell). But if there is no purposeful trend in the investment market, then there are many empty signals that will not bring the expected benefits.

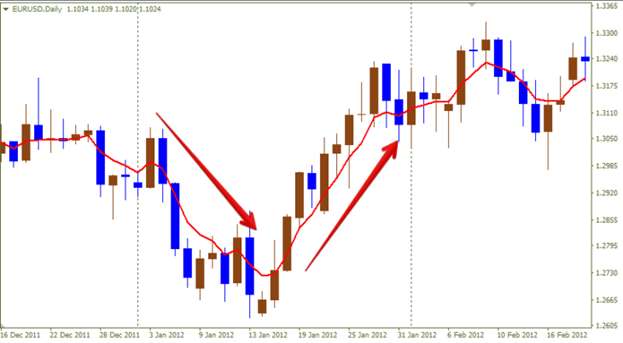
Determination of resistance and support levels
During the formation of these levels, the price may move away from the moving average. This happens more noticeably in the case of an exponential moving average with significant periods. At this time, it is most advantageous to enter into a position.

Three moving averages parallel to each other
Usually they are built almost parallel to each other. This is a very good opportunity to enter the height of a trend. If the action at the very beginning is depicted on the chart, then in the conditional language of traders, it can be described as “the open mouth of an alligator”.

Formulas for calculating each type of moving averages
Having become familiar with each type of moving average in trading, it is recommended to study their calculation formulas.
SMA Formula
In order to find out the indicator of a simple moving average, it is enough to apply the following formula:
SMA \u003d SUM (CLOSE (i), N) / N
Explanation:
- SUM is the sum;
- CLOSE (i) means the price of the presented period;
- N is the number of periods.
SMA is designed to balance the prices of a particular timeframe. The specific gravity of any subsequent value is set to the same. In case of tangible price jumps, SMA will take them into account along with the standard price trend.
EMA Calculation Formula
To calculate the exponential moving average, you need to write the formula as follows:
EMA = (CLOSE (i) * P) + (EMA (i – 1) * (100 – P))
Explanation:
- CLOSE (i) – price indicator of the given period;
- EMA (i – 1) – the degree of EMA for the previous period;
- P is a specific part of the price value.
EMA is the most commonly used type of moving average in trading. With its help, it is possible to eliminate the shortcomings of SMA. In this case, it turns out to find out the exact market situation in a particular period. And also the DEMA indicator – double EMA: https://articles.opexflow.com/analysis-methods-and-tools/indikator-dema.htm
SMMA Calculation Formula
To calculate the smoothed moving average, you can use the following formula:
SMMA (i) = (SMMA (i – 1) * (N – 1) + CLOSE (i)) / N
Explanation:
- SMMA (i – 1) – indicator of the previous candle;
- CLOSE (i) – current closing price;
- N is the degree of the smoothing period.
LWMA Calculation Formula
When calculating a linearly weighted moving average, you need to be guided by the following formula:
LWMA = SUM (CLOSE (i) * i, N) / SUM (i, N)
Explanation:
- SUM – sum indicator;
- CLOSE(i) – actual closing price;
- SUM (i, N) is the sum of the coefficients.
- N is the designation of the period.
Thanks to linearly weighted and smoothed moving averages, it is possible to even out the significance of prices for a specific calculation period.
Features of setting periods
Indicator parameters can be configured according to the user’s wishes. He can set a convenient time interval. The smaller it is, the more sensitive and accurate the moving average is in signaling. Despite various points of view, there is no “correct” time interval. To set the best timeframe, the user will have to experiment for a while. As a result, he will understand which period is the most optimal for him, according to his personal strategy. Moving Averages in TradingView:

Moving averages for scalping
“Scalping” is considered a slang term in trading. So called short-term trading strategies. Moving averages in scalping are distinguished by the implementation of a large number of transactions. This method is suitable for those who do not pursue global goals in terms of profit. In scalping trading, charts with small timeframes are often used. This strategy is old enough common, in recent times. This was due to the use of margin trading. This method is very effective and can bring good financial results. Scalping is convenient for traders who invest small deposits and stop at short-term cooperation. But this does not mean that the strategy is simple and less energy-intensive. The user will have to devote a lot of time to achieve high income. It is necessary to regularly view the intraday financial market in order to find a trading signal, as well as to support open transactions. Thanks to scalping, a trader will be able to attract a good income. The main thing is to test the trading system in practice, not to be afraid of experiments, to devote enough time to conduct transactions and do it systematically. Moving average indicator – QUIK trading terminal: https://youtu.be/ZOUMHFmpruk
Features of trading on moving averages, with examples
There are many trading strategies using moving averages. Among them, it is worth highlighting 4 main variations for trading:
- MA crossing by price;
- breakdown of 2 or more moving averages;
- false crossing MA;
- return to average.
Sometimes combinations of some indicators with others are formed. It is proposed to consider each of the cases in more detail. Crossing the SMA by the price is considered the simplest strategy that any user can apply, regardless of their level of knowledge in the field of investing. As for the Forex market, such a strategy will not be effective. If the SMA crosses from bottom to top, it will be possible to enter a long position, otherwise (from top to bottom), a short entry will be made. To exit the trade, you should wait for the next breakout.


Correct selection of the period for trading on a moving average
Debut traders are often interested in how best to choose a period for trading. In fact, there is nothing complicated, the main thing is to understand simple truths. For example, the moving average period is the number of candles on the timeframe. The time period of the moving average largely depends on how long the user can hold the trade. For example, he planned to keep the deal for about 1 hour. In this case, the indicator (12) on the 5-minute chart will do. Obviously, these are average prices for 1 hour. You can act a little differently. Suppose there is a desire to hold a position for 1-2 weeks. In this case, more than ever, EMA (7) and (14) on D1 will do. However, given the fact that there are only 5 working days in a week (because weekends are not taken into account), it is more logical to take EMA (5) and (10).
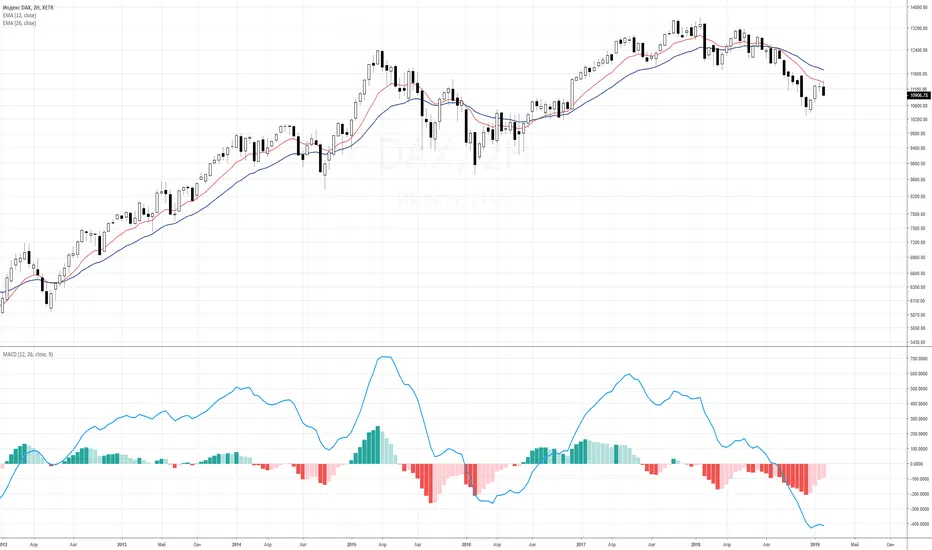
Position of moving averages in the stock market
There is definitely room for expansion here. Since moving averages are much more important in the stock market, it is worth understanding this issue thoroughly. The reason lies in the difference between the Forex market and typical exchange instruments. If you delve into the details, it becomes clear that on Forex the ratio of the economies of two separate states can be extremely unpredictable. The situation changes regularly. Therefore, currency pairs often change their direction dramatically. Moreover, there is no clear trend for a constant increase, or vice versa, for a sharp fall. As far as the stock market is concerned, booming stocks and indices are rising flat and becoming even more predictable. However, during periods of crisis, there are large movements and jumps that are difficult to predict in advance. Thus, it turns out that the stock market is practically a pure brand, with few exceptions. This means that you can really make good money on moving averages if you take this activity seriously.


