What is a stock order book in trading, how to read and analyze it. What is the trader’s glass filled with? Market glass is a table that displays orders to buy and sell securities in the financial markets. It provides information about current supply and demand, being an important analysis tool for both traders and investors. In this article, we will consider the role and significance of this tool. 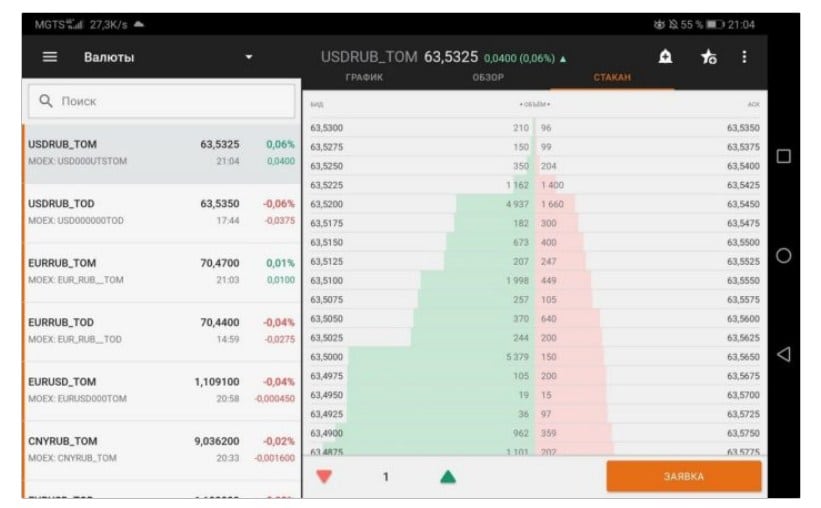
How to understand the order book
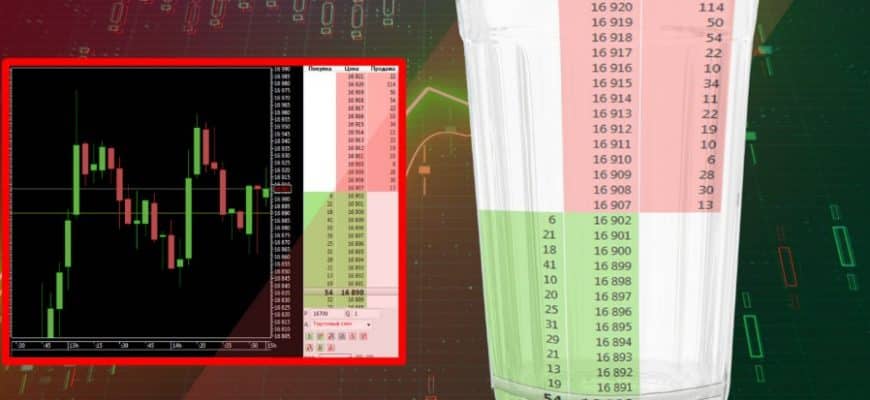
The order book is an important tool in the world of finance and trading on the stock exchange, which provides information about current orders to buy and sell assets. The structure and appearance may vary depending on the specific exchange and trading platform, but in general they have similar features. Sell orders are located at the top and are highlighted in red. They are called asci (from the English ask – “demand”). Purchase orders, they are also bids (from the English bid – “offer”) are located below and are marked in green. 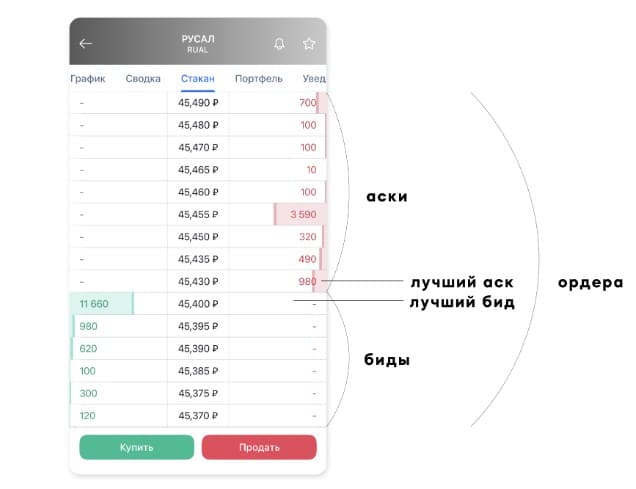
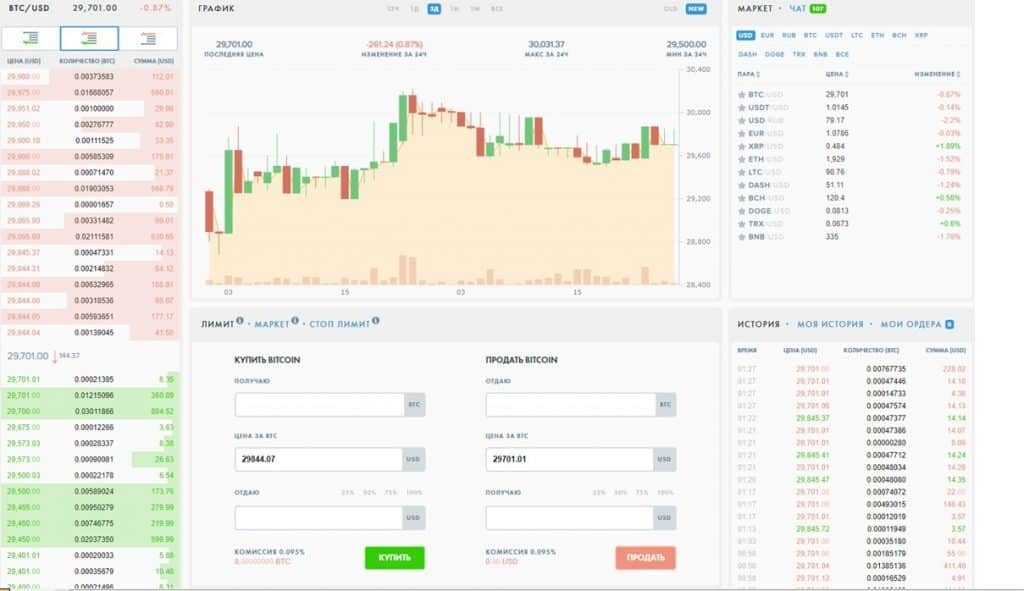
How to read order book on the stock exchange
Reading the order book can be a complex process that requires certain skills and understanding of the basic principles of market dynamics. Here are a few key aspects to consider when analyzing.
Definition of supply and demand
The market glass in trading shows current orders for buying and selling assets. High demand at a certain price level usually indicates that many traders are willing to buy an asset at that price, which can push the price up. High supply at a certain level may indicate that many traders are ready to sell the asset, which may put pressure on the price down. Analysis of supply and demand can help in understanding the current dynamics.
Interpretation of volumes and prices
These indicators can be especially important. High volume at certain price levels can indicate a lot of interest from traders and that these levels can be strong support or resistance levels. However, if volumes are low at certain price levels, this may indicate that the market is less liquid and they can easily change when new orders appear.
Practical Tips for Analysis
When analyzing the order book for making trading decisions, it is worth considering a few tips. First, pay attention to the most significant price and volume levels that can affect market dynamics. Second, keep an eye on changes in supply and demand and how they can affect prices. Third, use the order book in conjunction with other analysis tools such as charts and technical indicators to get a better picture. Analysis can be a complex and demanding process that requires experience and understanding of the market. This is an important tool for traders, but should be used in conjunction with other analysis tools and always consider your own strategy and risk profile when making trading decisions.
What are the features
One of the main features is transparency. The DOM allows you to see the current best buy and sell offers, as well as order volumes at each price level. Thanks to this, traders can quickly assess the market situation and decide whether to buy or sell securities. Dynamics play an important role during active trading sessions. The situation is constantly changing, reflecting changes in supply and demand. The study of dynamics allows traders to determine the current state of the market and make appropriate decisions.
Pros and cons of using
The use of an exchange glass has its advantages and disadvantages, which are important to consider when using it. Advantages of using an exchange glass:
- Transparency : Provides traders with real-time access to information about current market orders, allowing them to better understand the current situation and gauge market sentiment.
- Market Depth : Reflects not only the best buy and sell prices, but also order volumes at different price levels, which can be useful for assessing buying and selling pressure in the market.
- Responsiveness : updated in real time, which allows traders to quickly respond to changes in the market situation and make quick trading decisions.
However, the use of an exchange glass also has its limitations and disadvantages:
- Possibility of market manipulation : May be subject to manipulation, such as placing fictitious orders or removing orders to create the illusion of supply or demand, which can distort the real picture of the market.
- Limited Information : Displays only information about orders placed on this exchange and does not take into account orders placed on other exchanges or hidden orders, which may limit the completeness and accuracy of information for market analysis.
- Difficulty of Analysis : Can be difficult to analyze, especially for beginner traders, due to the large amount of information and fast data updates requiring fast decision making. Errors in the interpretation of information can lead to incorrect trading decisions and loss of funds.
The order book is a powerful tool for market analysis, however, its use is also associated with a number of limitations and risks. Proper use of the tool requires careful analysis of information, verification of its reliability and development of a trading strategy, taking into account its pros and cons. What is an exchange order book, how to read and analyze the order book on the exchange: https://youtu.be/Je4VnMlPkaU
Examples of using
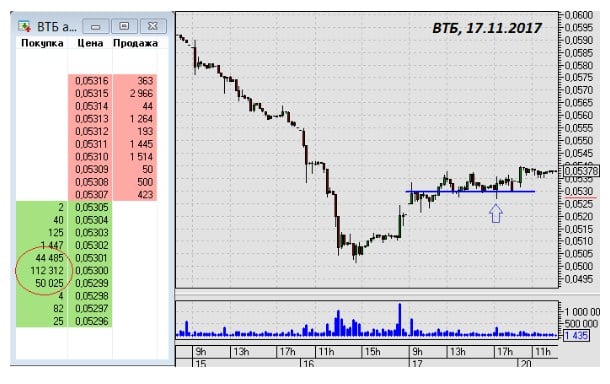
One of the common scenarios for using the order book is to analyze market liquidity . The tool displays orders to buy and sell an asset with price and volume. By analyzing the structure of the order book, traders can assess the presence of a sufficient volume of orders at certain levels and how deep they are located. This can help traders determine how liquid the market is and how easy it is to make a trade. If the order book shows a large number of buy or sell orders with high volume at a certain price level, this may indicate strong support or resistance at that level, which may influence the decision to enter or exit a position. Another example of use is the analysis of the dynamics of the cost and orders in the market.. Using the DOM, you can track changes in the volume and prices of buy and sell orders in real time. Watching the dynamics of orders can help traders determine the mood of the market, such as how active buyers or sellers are at the moment. If you see a large number of buy orders with increasing volume and decreasing price, this may indicate strong buying pressure and a possible increase in the value of the asset. In the order book, you can track the distribution of orders by cost, volume, change dynamics and other information. This can help traders to more accurately visualize the situation on the market and make adequate trading decisions. According to the density of orders, their number and spread, you can quickly assess liquidity, the amount of slippage of a market or stop order and what volume can be quickly gained without “smearing” the position by prices. For example, below are the glass of shares of Sberbank-ao and Sberbank-ap: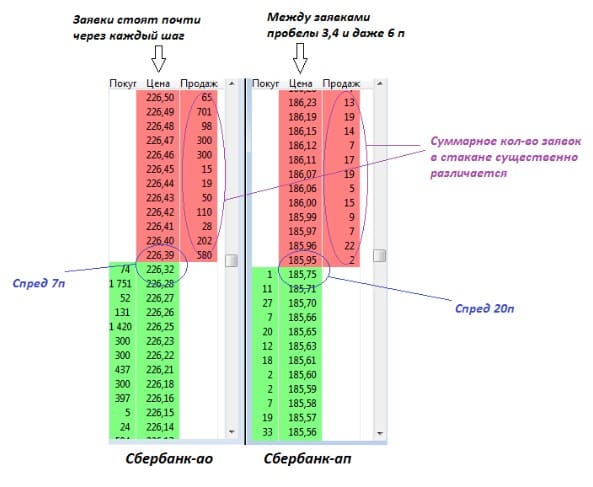


Как им работать