
MACD indicator (Moving Average Convergence/Divergence) in trading – description and application, how to use, trading strategy. The MACD indicator (Makdi) is one popular oscillator, which in 2022 is included in the standard package of indicators of any terminal. The indicator, as the name implies, is based on the convergence and divergence of Moving Averages, it was invented by the famous trader Gerald Appel.


- MACD logic
- Trading signals
- Divergence
- Crossing MACD lines
- Application of the MACD indicator in practice
- Types of MACD indicator
- MACD in popular terminals
- MACD in QUIK trading terminal
- MACD in the Metatrader terminal
- How to set up the MACD indicator
- Trading strategies based on the MACD indicator
- Combination of indicators
- Trend strategy
- Divergence and Convergence
- Work on multiple timeframes
- Advantages and disadvantages of the MACD indicator
MACD logic
The principle of the indicator is simple – it shows the ratio of the short-term period relative to the long-term one. With it, you can determine the strength of the trend. If the trend starts to accelerate, the indicator draws higher and higher bars, the indicator line deviates more from the signal line. A trend is considered stable if the histograms are high and of the same color. If the colors of the histogram quickly change each other, there is uncertainty in the market. When the trend slows down, the bars begin to decrease, and the Macdi lines converge. This indicates a period of consolidation or a likely reversal. By default, the periods of moving averages are 12-26, and the signal line has a period of 9.
A trader can experiment with these values, adjusting them to the instrument and timeframe, but keep in mind that the period of the fast moving average should be half that of the slow one.

Trading signals
The MACD indicator gives several types of signals, a trader can predict the price movement using a histogram or indicator lines:
- Histogram crossing zero . This signal indicates the convergence of the short-term and long-term moving averages. If the indicator crosses zero from top to bottom, sales are opened, and if from the bottom upwards, purchases are opened. A protective stop loss is set for the nearest extremum or as 0.2-0.5% of the asset movement.
- MACD histogram at the top and bottom of the market . Traders note the behavior of the indicator’s histogram at price extremes. If the price makes a powerful leap towards the trend, and the histograms become smaller, the trader concludes that the trend is nearing completion. In such a situation, the user is looking for countertrend trades, protective stop orders are placed above the extremum. They must be installed, on a strong trend, by inertia, before a reversal, the price can rewrite the maximum or minimum two or three times. The histogram in such situations shows overbought and oversold areas.

Divergence
The strongest MACD histogram signal is a divergence that occurs at the end of a trend when the market is about to reverse. This signal is not easy to notice for beginners; it is used by experienced traders. The price continues to make new extremes, but the histogram of the indicator does not. There are situations when divergence breaks down. The next price extremum coincides with the histogram extremums, although before that the indicator could not set a new peak. Therefore, it is very important to set a protective stop loss. A bearish divergence occurs on an uptrend and a bullish divergence occurs on a downtrend.
Crossing MACD lines
When the signal line crosses the main one from top to bottom, traders predict an imminent decline in quotes. And vice versa, they buy when crossing from the bottom up. On small timeframes, you can find many signals for the intersection of the indicator lines, but most of them are false. It is worth paying attention to the signals on the daily and weekly charts. The histogram of the indicator is used as a filter – purchases are made only when it is above zero, and sales are made when it is below zero. You need the coincidence of two conditions – the intersection of the lines and the histogram in the required position.

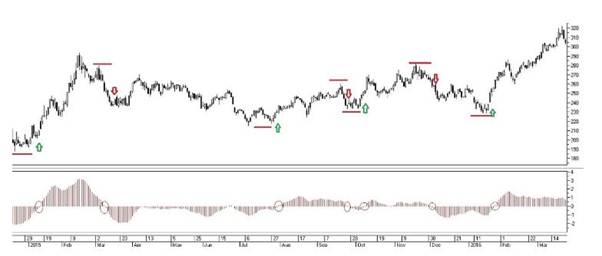
Application of the MACD indicator in practice
The indicator performs well when working in channels, you can catch movements from resistance to support and back in overbought and oversold areas. But do not forget that with a strong trend, the price does not notice levels and repurchase / resale. Macdi shows the beginning and end of a trend. Shows points of acceleration and deceleration of the trend. Effective in a volatile market, during periods of small price fluctuations, a trader will catch a lot of stop losses. First of all, the indicator was created to catch trend movements. In a wide flat on the daily chart, it can give good signals on the hourly.
Types of MACD indicator
The indicator consists of lines and a histogram. Some traders do not pay attention to the MACD lines, they attach importance only to the histogram. To remove the excess, we came up with a kind of MACD histogram indicator. It consists only of a histogram. In the classic form, the histogram and MACD are in the same window (for example, in the Metatrader terminal). In some terminals (such as
Quik ), the histogram and lines are separated into separate windows. The indicator can be built using exponential, simple, volume-weighted moving averages. In some terminals this is implemented as a parameter (Metatrader), in others there is a special name for each type (MACD Simple, MACD Weighed, MACD). for example, in the FinamTrade terminal. How to trade with the MACD indicator: https://youtu.be/0nihqQyGvOo
MACD in popular terminals
The indicator is included in the basic set of any modern terminal. It is present even in the broker’s mobile applications. To enable it, you need to go to the indicators menu and find MACD or MACD-Histogram.
MACD in QUIK trading terminal
To display the indicator on the chart in the Quick terminal, you need to click Paste. The Add Graph dialog box will be displayed. In it, select MACD or MACD histogram and click the Add button. To change the indicator parameters, go to the Properties tab.

MACD in the Metatrader terminal
To add the Macdi indicator, you need to click the Insert – Indicators – Oscillators – MACD button. A window for setting parameters will appear, you can select the period of the moving averages, the color scheme and the type of the moving average. 
How to set up the MACD indicator
By default, the indicator has the following settings:
- slow moving average 26;
- fast moving 12;
- signal -9;
- apply to closing prices;
- exponential type.
- the colors of the bars are red and green.
By changing the periods of moving averages, you can change the speed of the indicator’s reaction to price changes. On small periods there will be more signals. You can either increase or decrease the period of the moving averages. With an increase in the period, the quality of the signals will increase, there will be fewer of them, but the profit/false ratio will be higher. But sometimes the indicator will not see the beginning of a trend. By decreasing the parameters, you can achieve an increase in sensitivity. It is important not to miss the moment of the “golden mean”, between the number of signals and their quality.

Trading strategies based on the MACD indicator
Depending on the strategy, the Makdi indicator is used as part of a set of indicators or separately.
- Channel strategy – is used in the market without a pronounced trend. The trader expects that the price will remain in the range for a long time. To determine the “top and bottom” traders use Bollinger Bands, Price channel, trend lines, moving averages. In this case, the price can be in two positions:
- Bottom of the range . When the price approaches the edge of the range – the bottom of the Bollinger, moving with a long period, trend line, the trader carefully watches the MACD indicator. A long trade is opened if the histogram bars decrease, there is a divergence, the bars change color to green and there is an intersection of the indicator lines (one condition is enough if there are 2 or more signs – signal strengthening). The stop is set beyond the extreme. It should not exceed 0.2-0.5% of the asset movement. If it is not possible to put a short stop, you need to reduce the size of the position.
- Top of the range . When the price approaches the edge of the range – at the top of the Bollinger, moving with a long period, trend line, the trader carefully watches the MACD indicator. A short trade is opened if the histogram bars decrease, there is a divergence, the bars change color to green and there is an intersection of the indicator lines (one condition is enough if there are 2 or more signs – signal strengthening). The stop is set beyond the extreme. It should not exceed 0.2-0.5% of the asset movement. If it is not possible to put a short stop, you need to reduce the size of the position.

If you carefully look at the price holding in the range, there is often a situation when the boundaries of the range break through, but later the price returns to the price range. The boundaries of the top and bottom are expanding. A trader should carefully look at the readings of the MACD indicator so as not to miss the moment of a trend slowdown. It may come before or after the price touches the edge of the range.
In the middle of the range, new deals are not opened. A trader can strengthen positions if the price breaks through the middle of the Bollinger or moving average on a small period (9-21 on D1).
Combination of indicators
Some traders use several oscillators at the same time. Transactions are concluded with a pronounced trend (all indicators give the same signals) or in the zone of critical overbought or oversold for a rebound. Traders use
the RSI indicator , stochastics, Bill Williams’ wonderful oscillator (AO),
moving averages together with Macd . Additionally, it strengthens the signal if a Price Action pattern occurs in the buy or sell area.
Trend strategy
Trades are opened only when the MACD is below or above zero (to sell or buy, respectively). Additionally, they use filters – trend, other oscillators, moving averages. A short trade is concluded only when the trend is confirmed – support / resistance is lost, there are graphic patterns for confirmation, indicator readings indicate strong sales / purchases. When the levels are broken, if the indicator does not indicate a slowdown in the trend, the trader strengthens positions and moves the stop behind the market.
Divergence and Convergence
A strong signal is a divergence between the price and the indicator. This may indicate the end of a long-term trend. Such signals should be looked at on large timeframes – daily or weekly. The price reversal rarely happens in one day, more often they give you the opportunity to enter with a clear stop, no more than 5% of the asset movement.


Work on multiple timeframes
A trader watches several (usually three) periods. For long-term trading it is 1h, daily and weekly, for intraday it is 15-1h-4h, for scalping it is 1-m15-1h. On the oldest period, a long-term trend is tracked. The current trend is determined on the average. We are looking for the entry on the smallest period. To enter long:
- senior period – long;
- middle – long;
- the younger one is short, we are looking for a price reversal by convergence of lines or divergence.
The stop is set for the lower period, and the take is for the middle one. In the case of a short, the indications are similar. If all three readings are unidirectional, we do not trade.
Advantages and disadvantages of the MACD indicator
The indicator is included in most trading strategies based both on channel trading (overbought and oversold areas) and swing trading. Advantages of the MACD indicator:
- high-quality signals in a volatile market;
- accurate signals both on large timeframes and on small timeframes up to m1. In each case, you need to select the indicator parameters. On small timeframes, m1-m5 is used in the scalping strategy ;
- universal – you can trade on any assets (stocks, indices, commodities, metals, currencies);
- effective when trading with the trend.
Disadvantages of the MACD indicator:
- on small timeframes, additional filters are needed;
- the indicator is late, on small periods it entails false signals. On large timeframes, this is not so important, because there is a lot of time. On small periods, the indicator prohibits a signal when the movement is already over;
- does not work well in flat;
- does not work with low volatility – the histogram just spins around zero. Signals are not strong, stops are often knocked out.
How to work with the MACD indicator – a teaching lesson on trading: https://youtu.be/iuFQxnCuz9w In 2022, the Internet is full of offers of “super profitable” indicators. As a result, the chart resembles a festive tree of various indicators. With such a variety, some have forgotten about the usual standard indicators. And they have not lost their relevance. The very principle of oscillators is the same, you can come up with a little something new. Currently, the MACD has improved versions, but the indicator itself is also successfully used in trading strategies. Understanding how it works is the key to effective trading. MACD is a universal indicator, you can track the strength of the trend and find reversal points in overbought and oversold areas. It will be useful for beginners, MACD is a trend indicator and will not allow you to get up against a strong trend.


Been trading MACD-based systems for years and this article nails the core issue – MACD works, but only in certain market regimes, which is exactly why most single-EA strategies blow up in live trading. I’ve tested 20+ EAs chasing the perfect indicator setup, and they all fail the same way: stellar backtest, brutal drawdown when market conditions shift. That’s why I switched to running Ratio X Toolbox on MT5 – having 10 different EAs means I’m not forcing MACD or any single indicator to work in every scenario. Do you find that most traders underestimate how much market regime matters when building their strategies?