How to use the ATR indicator, how the average true range looks on the chart, setting, trading strategies based on the ATR indicator, when to use it and on what instruments, and vice versa, when not to. ATR (average true range) indicator refers to a
technical analysis indicator that calculates market or price volatility. This helps to analyze the
volatility associated with changes in the value of any security and then choose the best time to trade. The ATR is considered to be a very popular trading indicator, but it is common to see traders interpreting or using the ATR incorrectly.

What is the indicator and what does the indicator show on the ATR chart
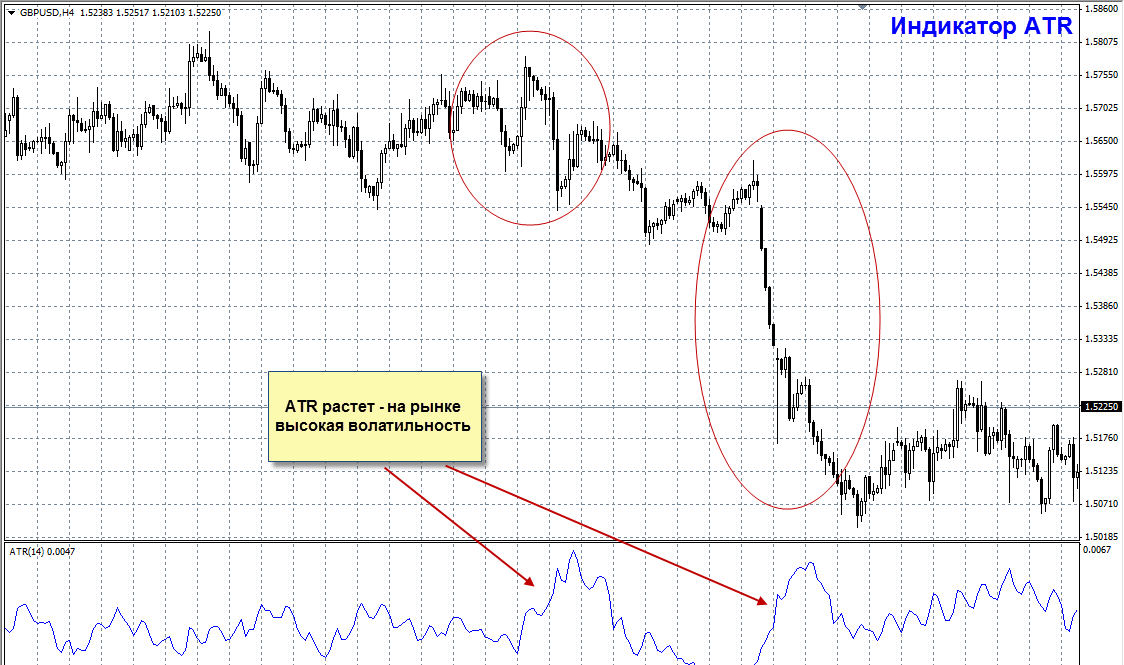
ATR is a technical indicator that measures the volatility of an asset’s price. Since the ATR is a volatility indicator, it shows how much the value fluctuates on average over a specific time frame. The average true range reaches a high value when price fluctuations are large and fast. The minimum values of the indicator are typical for periods of lateral movement of long duration, which occur in the upper part of the market and during consolidation.
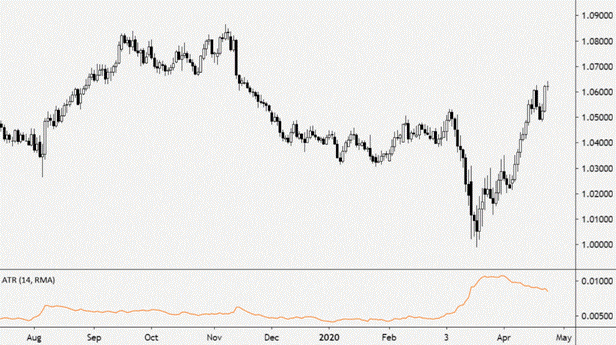
- The higher the indicator value, the more predictable the trend change.
- The smaller the value, the weaker the trend movement.
Important! The indicator does not show price trend indications, but simply the degree of price volatility.
ATR values are mostly calculated for 14 day periods. Analysts use it to measure volatility for any duration, from intraday time frames to higher time frames. A high ATR value implies increased volatility, while a low ATR value indicates minimal volatility. https://articles.opexflow.com/trading-training/time-frame.htm
An example of calculating the ATP indicator
ATR as a tool to measure the volatility of stocks, forex and commodities can also be used in crypto trading. It is well suited to the crypto environment due to high volatility attributed to the exponential escalation and fall in cryptocurrency prices. The method can calculate the price movement for a certain period. However, ATR does not directly indicate the direction of the crypto trend. Instead, it gives a signal of a trend change. The higher the ATR value, the higher the probability of a change in the trend of Bitcoin / other cryptocurrency and the lower the value, the weaker the fluctuating movement.
What does the ATR indicator show?
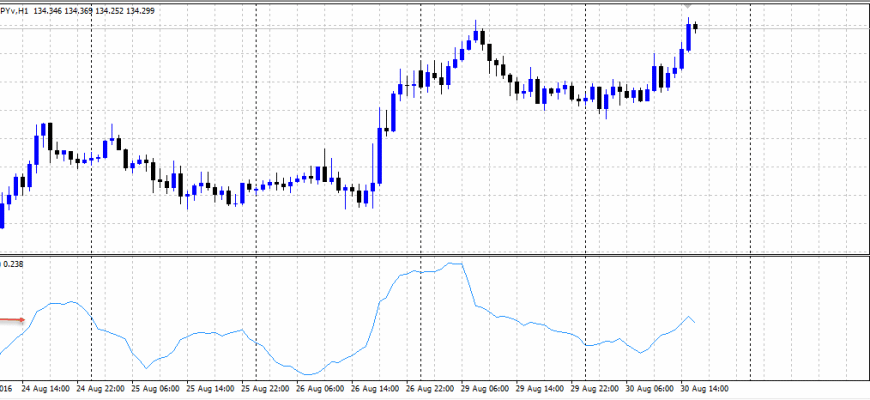
This indicator is available in any trading program, including the MT4 terminal, and can be added to the chart screen via the Insert menu. It appears on the screen as a signal line under the main chart.
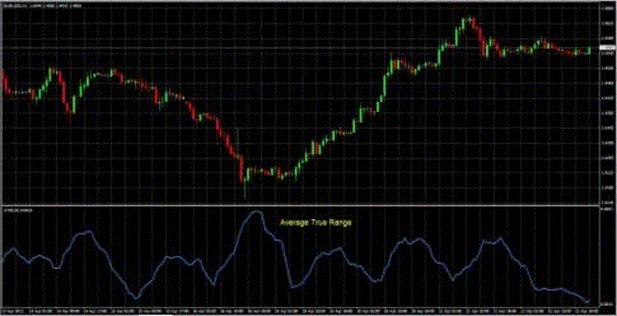
ATR Calculation Formula
The True Range is the largest of the following values:
- the difference between the past closing price and the current high;
- the difference between the actual maximum and minimum;
- the difference between the past closing price and the current low.
True Range = Max(High[1]-Low[1]; High[1] – Close[2]; Close[2]-Low[1]) Average True Range is considered a moving average of the true range: Average True Range = SMA (TR,N). As for the settings, in this case only the averaging period equal to 14 is available.
ATR Calculation
So, how is ATR calculated based on simple examples of candles. Any trader needs to understand how his indicators are created in order to take the right action. ATR stands for Average True Range, which means that ATR measures how much price moves on average. Below you can see a few examples of what the indicator uses for its calculations. As it moves up, it sets the distance between the last close and the candle’s current high (left). During the decline, the ATR looks at the past close and the near (middle) candle. At the minimum distance between the previous close and the current low, the indicator will look at the full range of the candle and take high and low (right).
Principle of operation
ATR allows you to predict a trend change using an average and identifying volatility. If the ATR value rises, there is high volatility and a high probability of a trend change. Likewise, a low ATR refers to lower price volatility. Essentially, it follows the fundamental concept of a security range (price high – price low); if the range is high, volatility is high and vice versa. The ATR indicator is non-directional. It has more to do with predicting a trend change than with its exact direction. It never specifies direction, such as whether a bullish reversal will occur or not. The ATR is more useful as an indicator for finding breakouts, detecting entry signals, placing stop losses. In addition, it is always used in combination with other indicators,
trend lines . 
Using ATR to Exit a Position
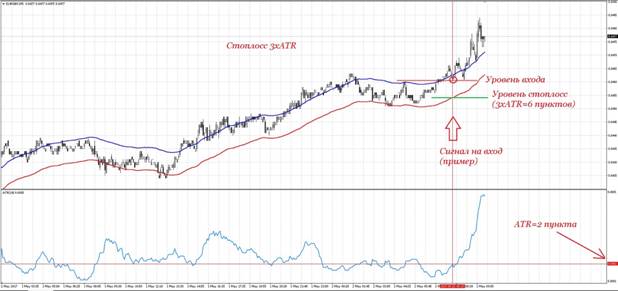
ATR is often used to set an adaptive stop loss, as well as floating and fixed. For trading, the idea of setting a stop loss based on volatility is often used. In order to calculate the required stop order size, the index value is multiplied by some constant, which varies from the theoretical duration of the future trade. As an example, consider the constant 2-4 for hourly charts. Let’s say, in the case of a transaction on EURUSD with ATR = 0.0062 on the hourly chart, you need to multiply 6.2 by a constant, let’s say 3, and the stop will be 18-19 points.
Using ATR as a filter
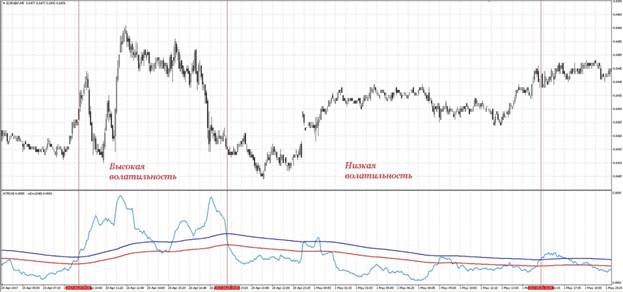
ATR is also used as a trend filter. This is done by drawing a median line on the ATR chart. When this line is broken, the most significant price moves occur. The indicator cannot and should not be negative, nor should it have a defined middle line. It is chosen by eye, in each specific case. It is best to place a long-term
moving averageon the ATR chart as the middle line. Although the ATR is below its moving average, the fluctuations are minor and the market is calm. When the ATR crosses above the moving average, a trend begins. Also, experts advise using the indicator on different timeframes, for example, on H1 and D1. If their directions coincide, and on a lower time frame the indicator crossed the middle line, then the market has made a jump. Again, you need to adjust the ATR and the median line separately for each market and for each timeframe.
Envelopes, volatility is low, and strong volatility is expected after the channel breaks up. 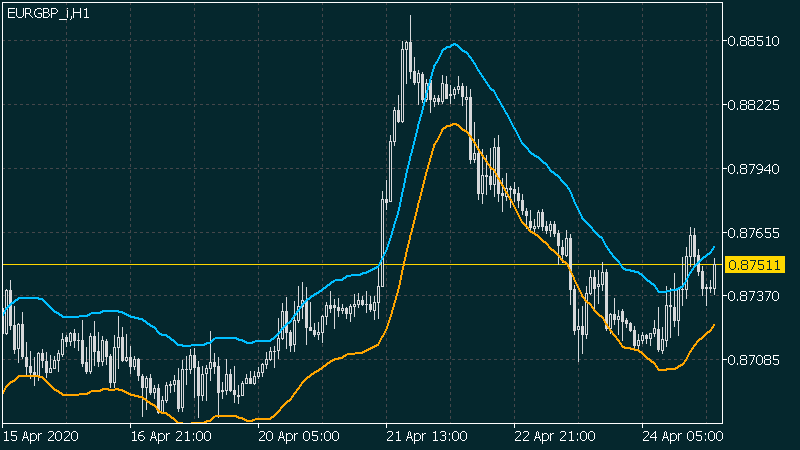
ATR+DATR
It is also necessary to understand the general direction of the market and the higher status of the time frame. Most specialists trade on lower timeframes and don’t take into account what they have noticed on higher timeframes after analyzing different timeframes. DATR is a daily average true range indicator. In this case, volatility is measured exclusively on the daily timeframe. For example, the DATR may go all the way down, while the lower time frame ATR will move in waves. However, all the lower time spikes in ATR volatility can be very short-lived. This demonstrates that understanding the overall higher time frame situation is critical to understanding what can happen on the lower time frames.
Pros and cons of the ATR indicator
Pros:
- suitable for working on different timeframes – for short-term intraday trading and for investing on long-term charts.
- available by default on popular trading platforms;
- has a variable period for setting the sensitivity;
- ATR will also help you understand the profit potential of trades;
- Usually traders look at the ATR value to determine the stop loss level, but there are other ways to use it.
Minuses:
- the indicator is not a self-sufficient tool, it does not provide trading signals. Therefore, you need to use ATR in combination with other methods of making trading decisions.
Finally, this indicator expresses the growing volatility. Traders need volatile stocks to find potential trades. The ATR can signal whether volatility is present and strong enough to potentially form a trend. ATR can be called a good solution when it comes to adapting to changing market conditions. However, it can also be the best indicator for predicting market turns once there is a significant change in volatility. Most traders experience inconsistent results, which is often the result of an inflexible trading approach. Together with the volatile behavior of higher timeframes and the difference between uptrends and downtrends, the ATR creates a versatile trading tool.
