Consolidation and flat in trading – what is it, is there a difference between the concepts, trading strategies.
- the predominance of buyers in the market causes increased demand, which means an increase in prices;
- the predominance of sellers causes a decrease in price.
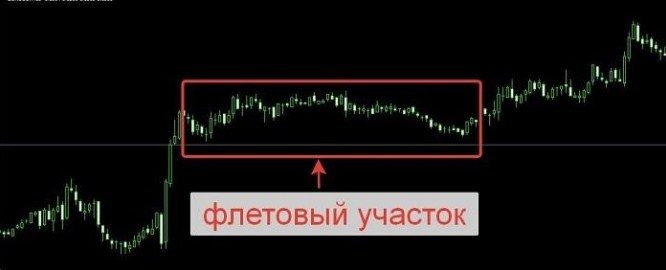
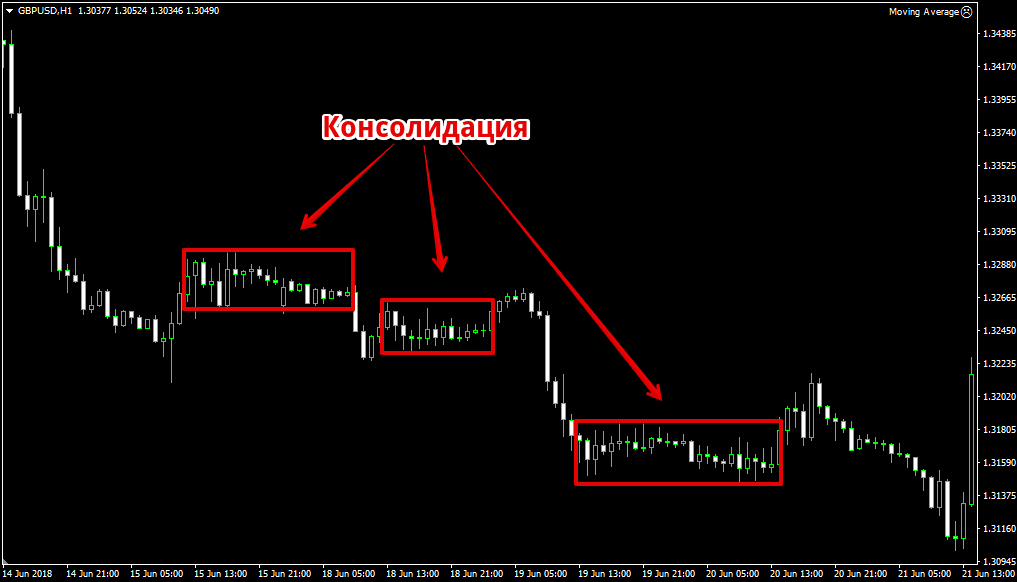
Consolidation (flat, flat) is a period of market price equilibrium, in which the number of sellers and buyers in the market is approximately the same. In other words, the market is in a state of accumulation or distribution. One of the reasons for consolidation is the low liquidity of the market instrument. On the chart, this period looks like a lateral price movement in a limited range.

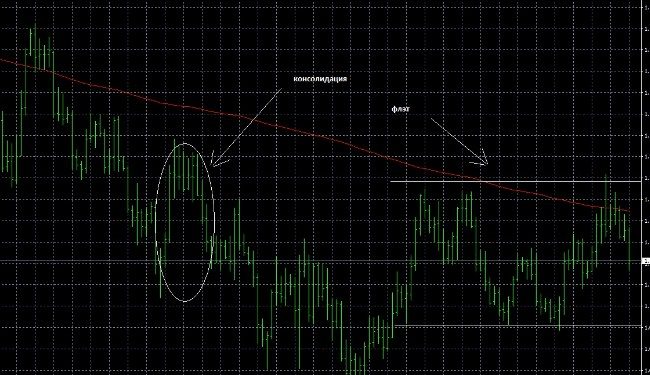
- flat is a long period of calm, and consolidation is a short-term respite;
- flat moves in a relatively wide price range , in comparison with it, the amplitude of price movement during consolidation is small.
- Narrow and wide flat
- Why does a flat occur?
- How to determine the flat
- Indicators
- Non-indicator determination of flat at an early stage
- What is the danger of sideways trading?
- Advantages and disadvantages of trading during consolidation (flat)
- How does the breakdown of the boundaries of the flat happen?
- Flat trading and consolidation strategies
- scalping
- Channel Strategies
- Waiting for a breakdown
- Trading on a rebound from the boundaries of the trading range
- Flat trading tips for novice traders
Narrow and wide flat
Speaking about the width of the flat, they mean the gap between the upper and lower boundaries of the price range. The greater the distance, the wider the flat. This indicator is measured in points. A narrow flat is formed when demand is almost equal to supply. This is the period of maximum calm, when no important events are expected.


Why does a flat occur?
Several reasons
- Reducing the volume of commercial transactions . On weekends and holidays, stock exchanges do not work, and on Fridays or before holidays, trading is sluggish. Trading in small volumes of funds cannot affect the price change, and therefore cannot cause the beginning of a new trend.
- Waiting for significant news . Important economic or political news and events may cause quotes to move in an unknown direction. Therefore, traders, while waiting, do not risk opening new positions, the entire market freezes.
- Low liquidity of the trading instrument . A flat can occur if the trading instrument is not in demand, so there are few or no sellers and buyers.
- Demand equals supply . A situation may arise in the market when the size of the volumes of transactions made is sufficient to initiate a trend, but the same number of buyers and sellers balance each other and cannot cause a sharp price change.
- Influence on the market of large players . Large companies, in their own interests, can artificially maintain the stability of a trading instrument.
How to determine the flat
During a flat, the price moves in a horizontal channel, during a trend – in an oblique one. The screenshot below shows the differences between a flat and a trend channel.

Indicators
The state of the flat is shown by many indicators. For example, stochastics and RSI reflect the current price of an asset compared to past data, which means they clearly show a trend line. If the charts of these indicators move in the middle, then this indicates the formation of a flat.
Moving averages reflect the average value of quotes in the selected segment, so they do not work well during a calm period in the market. Flat indicator – frequent convergence, coincidence of lines. This indicator is not very informative during a flat, so it is rarely used. The Pulse Flat indicator is similar to working with the Awesome Oscillator and
Macd, but its functionality is richer. Yellow circles indicate a trend (bright red histogram is down, bright blue is up). Green circles mark the flat period (the histogram is colored dark red or dark blue).

Non-indicator determination of flat at an early stage
To determine the beginning of consolidation without an indicator, mark 4 points on the price chart.

What is the danger of sideways trading?
Trend trading is convenient, understandable and least risky. And during a flat period, it is very difficult to predict in which direction the price will turn. Usually, a flat ends with a strong trend, so trading in large volumes is associated with high risks. And trading in small volumes due to low volatility gives almost no profit. Formally, the flat can be divided by support and resistance levels, opening long positions at the bottom of the channel, and short positions at the top. Trend indicators will give entry signals in close proximity to support/resistance levels, but after a couple of points the price will reverse. Thus, the entry on the signal gives the minimum profit, while there is a risk of not being able to close the deal in time.
Advantages and disadvantages of trading during consolidation (flat)
Before moving on to trading strategies, let’s look at the strengths and weaknesses of the flat. Let’s start with the disadvantages:
- price movement demonstrates uncertainty, so there are high risks of opening a deal at a point after which the price will make a turn;
- even successful transactions are unprofitable;
- during the flat period, the spread increases, which leads to an increase in trading costs;
- there is a high probability of a flat breakout; besides, “false” breakouts often appear.
Despite certain difficulties, some traders are limited to flat trading. So, the advantages of flat:
- flat strategies are clear and understandable, even a beginner can easily master them;
- lack of short and long offsets;
- easy risk management.
Consolidation and flat in trading – trading strategies: https://youtu.be/Kyt0WYsyUvc
How does the breakdown of the boundaries of the flat happen?
To determine the flat on the chart, it is necessary to set the support and resistance lines that form the channel. When a chart enters a channel, there are 3 options for the development of an event:
- the price will break the channel;
- bounce off the channel boundary;
- will expand the range.
According to statistics, the price most often bounces off the boundaries of the channel than breaks through it.
The breakdown of the flat and the beginning of a new trend occurs when sellers or buyers begin to dominate the market. This is one of the most profitable entry points to the market.
One of the dangers of trading during a calm period is false breakouts that do not trigger a new trend. False breakdown can be identified by several signs:
- penetration depth: the greater the distance the price has passed, the higher the chances of this trend consolidating;
- breakout speed: impulse movement indicates an accidental exit beyond the level (the price moves almost perpendicular to the channel border);
- the longer the price stays outside the channel, the more breakouts, the more chances for a clear trend to form.
Flat trading and consolidation strategies
Trend strategies do not work during a flat, operations are considered risky and unprofitable. However, there are strategies that allow you to successfully trade even in a narrow price range.
scalping
Scalping strategies involve opening fast trades. The profit from one transaction is minimal, but the speed of trading and a large number of completed transactions can significantly increase the deposit. Scalping uses a large leverage and a low spread. Trading is usually carried out on the M1 timeframe.
The main disadvantage of scalping strategies is a high level of stress, because. you need to open and close deals constantly, without being distracted, and at the same time follow the chart on large timeframes so as not to miss the breakdown and the end of the flat.
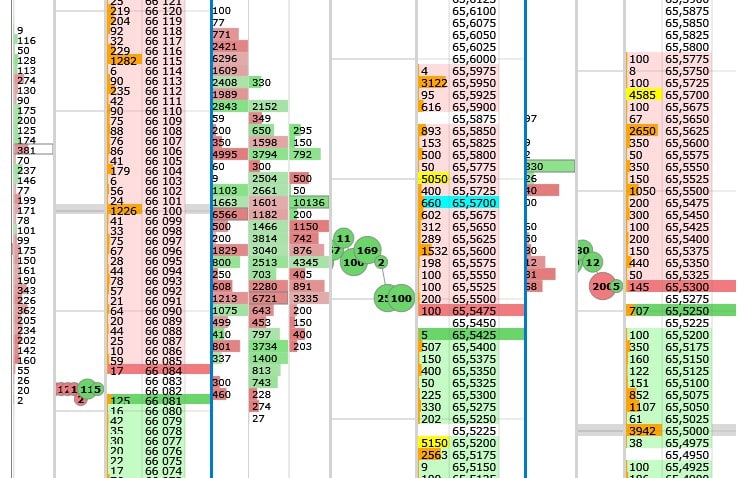
Channel Strategies
These strategies are used during a wide flat. The narrower the flat channel, the larger the spread and the smaller the profit. The principle of operation is simple – the purchase is made at the lower border of the channel, the sale is made at the upper one.

Waiting for a breakdown
The strategy is based on the expectation of a breakdown of the price channel and the formation of a new trend. To determine the beginning of a trend, pending orders are placed outside the channel at a distance of 15-20 points. If the channel is broken, the price chart catches the order and a deal is opened.
Trading on a rebound from the boundaries of the trading range
Bounce trading is one of the simple and profitable flat strategies in the price action system (without using an indicator). The strategy is effective on any timeframes, so you can open several deals at the same time. Rebound trading belongs to channel strategies, so during the work it is necessary to focus on support and resistance levels. Signal for action – two rebounds from the channel line. Theoretically, you can open positions on each rebound, but this is a riskier option. The procedure is very simple:
- We expect when the price comes closer to the channel border.
- We place a pending order just above or below the border (at a distance of about 15 points) with a small stop order.
- When the order is triggered, a deal is opened.


Flat trading tips for novice traders
- Avoid long-term trades during the flat period.
- Be sure to use stop losses , because when the channel is broken and a new trend begins, you can lose most of the deposit.
- Do not trade from levels on low timeframes, except for scalping.
- Do not set support/resistance levels based on extremes formed before the opening or closing of the exchange. These points are short-lived.
- Do not forget about the rules of money management, this will allow you to control risks.
- Use additional technical analysis tools. For example, reversal patterns such as a double (triple) top or bottom, an ascending (descending) triangle, a pennant, and a flag are often formed sideways.
- Be psychologically prepared for the beginning of a flat, and then its breakdown and the emergence of a new trend.
