MFI indicator – Market Facilitation Index (Market Facilitation Index), features, plotting on a chart, calculation formula. Market Facilitation Index – this indicator is used to determine the strengths and weaknesses of price movements. It was developed by trader and writer Bill Williams and described as a measure of the market’s reaction to a new level of volume.
What is the MFI Indicator, what is its meaning, calculation formula
The BW MFI market relief index is a volatility indicator, the purpose of which is to determine the market’s readiness to change the price. But only absolute values alone are useless for a trader, as they do not give specific trading signals. It is important as a tool for analyzing the effectiveness of a price movement that combines volume and price.

Important! Volume analysis is a technique used to determine the trades that are being made by discovering relationships between volume and prices. The two key concepts underlying volume analysis are buying volume and selling volume.
Traders rely on volume as a key metric because it allows you to know the liquidity level of an asset and how easy it is to enter or exit a position close to the current price. Liquidity is something you should always pay attention to when trading. A highly liquid market is considered the most efficient. The MFI indicator by Bill Williams shows the price change per tick. Description of the MFI indicator:
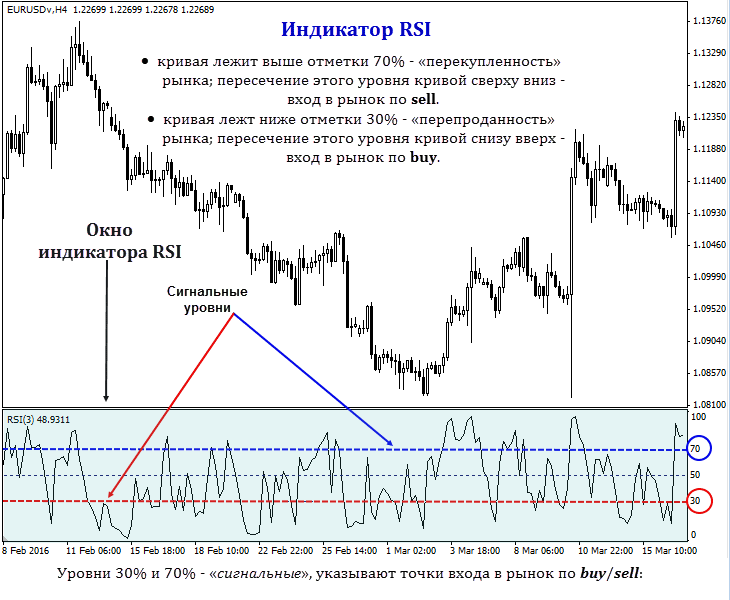
- The construction and interpretation of this indicator is similar to the Relative Strength Index (RSI), with the only difference being that RSI is only related to price. The Market Relief Index compares “positive cash flow” to “negative cash flow” to create an indicator that can be compared to price action to determine the strength or weakness of a trend.
- The cash flow ratio is normalized into the MFI oscillator . Cash flow is positive when the typical price is rising (buying pressure) and negative when the typical price is declining (selling pressure).
- The ratio of positive and negative cash flows is then entered into the RSI formula to get an indicator that fluctuates between 0 and 100.
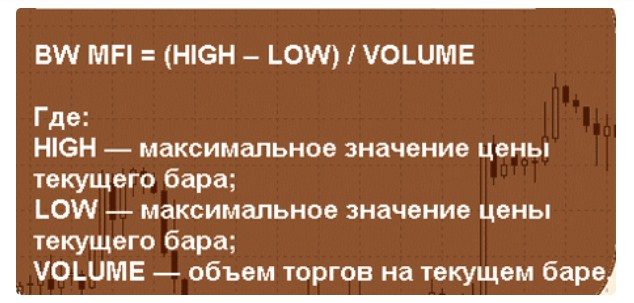
The Market Facilitation Index is easy to calculate using the following formula: MFI = (High – Low)/Volume, where High is the highest price of the trading session, Low is the lowest price of the trading period, Volume is the volume of the timeframe.Some experts consider the BW MFI indicator to be the best indicator of market behavior, compared to the relative strength index and the stochastic oscillator.
Types and construction, and recognition on the chart
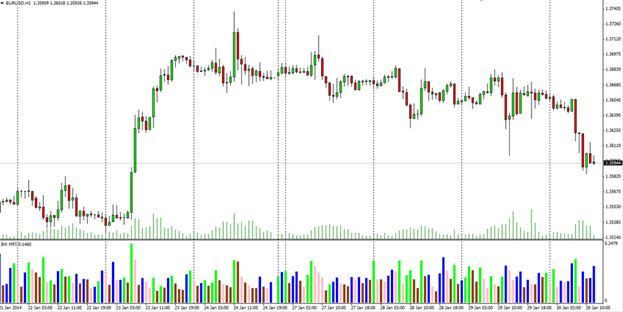
When plotted on a chart, the results of the Market Facilitation Index calculations are displayed as a histogram at the bottom of the price chart.
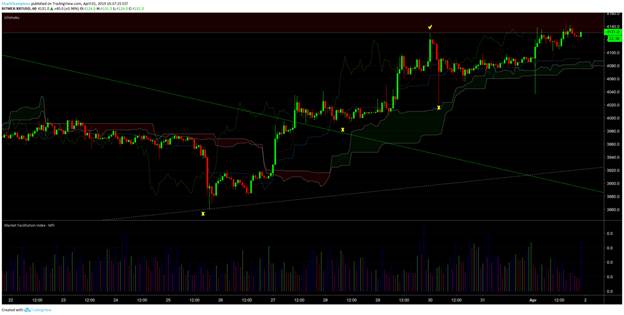
- A green (Green) bar indicates that both the indicator and the volume are increasing. This suggests that the market is already moving and traders should open a position in the same direction as the market, following the trend, and opposite positions should be closed.
- “Fade” reflects the end of a trend, which is characterized by a scenario in which both the indicator and volumes are declining. In other words, the market is losing interest in the current price movement and is looking for signs of future development. This bar is the forerunner of the big break. Market participants should watch for any signs of a constructive impulse, which in this case can be signaled in advance by the formation of several successive “fading” bars.
- “Fake” represents the period during which the indicator increases and the volume decreases. This suggests that the market is moving forward, but is not supported by volume. Due to the lack of interest on the part of traders, there is no strong support for the current price movement with the opening of new positions. In other words, the price moves as a result of an attempt by a certain group of market participants (brokers and dealers) to control and manipulate it in their own interests. The state usually ends with a price reversal.
- “Squatting” (Squat) reflects the situation when the indicator falls, but the volume increases. At this time, there is a battle between the “bulls” and “bears”, which will determine who will control the next trend. As more traders enter the market, the volume increases, but since the two counterparties are relatively equal, the price does not change significantly. In the end, one of the warring parties will catch up with the other. It is worth paying close attention to the direction in which the price moves after breaking through this bar.
Settings and application in a trading strategy
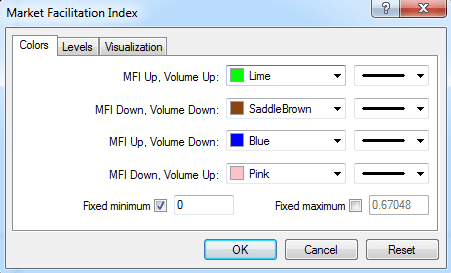
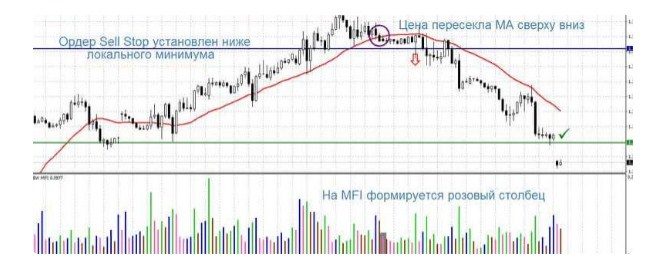
Unlike many other technical indicators, the MFI Market Facilitation Index has no settings. The only thing that can be customized is the color of the bars (or leave them as they are). Interpreting it is a relatively difficult task, given that there is no specific range to look at. How to use BW MFI indicator:
- The index and volume are falling – lack of liquidity in the market. Therefore, if an asset is in an uptrend and the MFI is declining, this is a sign that a potential reversal is about to occur.
- The indicator rises, the volume of the asset decreases – a sign that the price action is not supported by volume. As a result, a bearish reversal may occur.
- The indicator is falling, the volume is growing – “bulls” and “bears” are fighting each other. May lead to a bullish breakout.
Theoretically, the principle of operation seems simple, but in practice it is not easy to find trading signals using MFI. Therefore, it is recommended to use additional tools – RSI and
moving averages .
Should I use the Market Facilitation Index in trading?
Initially, trading indicators were used exclusively in the stock markets, but over time they began to be used in other financial markets. Despite the fact that these mathematical algorithms are widely used by traders, a good investment strategy is rarely based on them alone. The MFI indicator takes the simple aspects of market action and translates it into clear and concise terms that give an idea of market action. Like RSI, it is measured on a scale of 0 to 100 and is often calculated using a 14-day or 30-day period. A swing trader may prefer a 14-day period, while an investor may prefer a 30-day period (the fewer days used to calculate it, the more volatile the index). When analyzing the MFI index, in fact, one must first take into account the discrepancies between the indicator and the movement of the stock price. All indicators including MFI, are more useful when used in conjunction with other tools. Bill Williams himself recommended the Fractals indicator in addition.
Advantages and disadvantages
One of the problems with MFI is redrawing. This means that it doesn’t make sense to backtest or search through history, as this will lead to inaccurate information. This is a natural process when the indicator is redrawn. Experienced traders know that if any backtests are conducted while using the indicator, there will be false signals. Another problem is that the volume indicator does not reflect the real volume of the entire market, but only the one provided by the broker. Of course, there are positives that the indicator can signal big future price action. Proponents of volume analysis consider the MFI to be a leading indicator. In their opinion, it gives signals and warnings about possible reversals. Before making a trading decision, MFI should be combined with another oscillator, then track divergence patterns with strong volume. Once patterns are identified, it’s time to act. Divergence on the second oscillator will reduce the risk of MFI redrawing. To avoid confusion, it is recommended to use a small number of oscillators (the more oscillators are involved, the higher the probability of making mistakes).
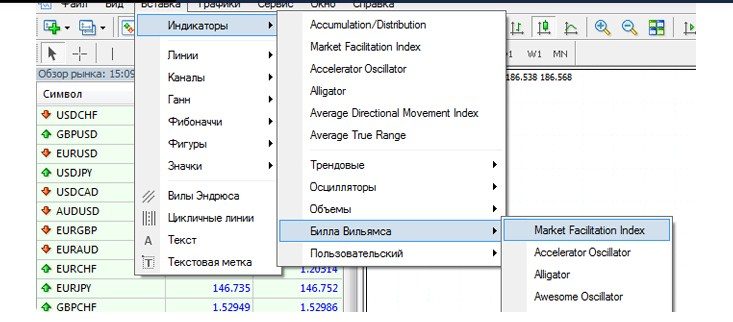
Application of MFI in different terminals
Most trading platforms like MT4, MT5 or TradingView offer almost all indicators with lots of options and automatic variations, and MFI is no exception. MetaTrader 4 has a set of trading indicators by Bill Williams, which are included in the standard tools when the platform is loaded. The BW MFI indicator can be found under the “Indicators” index, which will open the MFI window, including color code and volume.
