RSI indicator (Relative Strength Index), description and application of the relative strength indicator in practice in trading.
What is the RSI indicator and what is the meaning, the formula for calculating the Relative Strength Index
Decisions made by a trader on the stock exchange are always associated with a certain risk. In order to reduce it as much as possible, it is necessary to think over, formulate and apply a certain trading system. One of its important points is the ability to choose the right entry point for a trade. This can be done using the Relative Strength Index indicator. It was invented by trader Wells Wilder. He published an article about it in 1978. She appeared in Commodities magazine. It is interesting to note that Wells Wilder was an engineer by training. This indicator was discussed in more detail in his book New Concepts in Trading Systems. Over time, the Relative Strength Index has become very popular. Now it is included in the standard set of indicators of almost every
trading terminal. 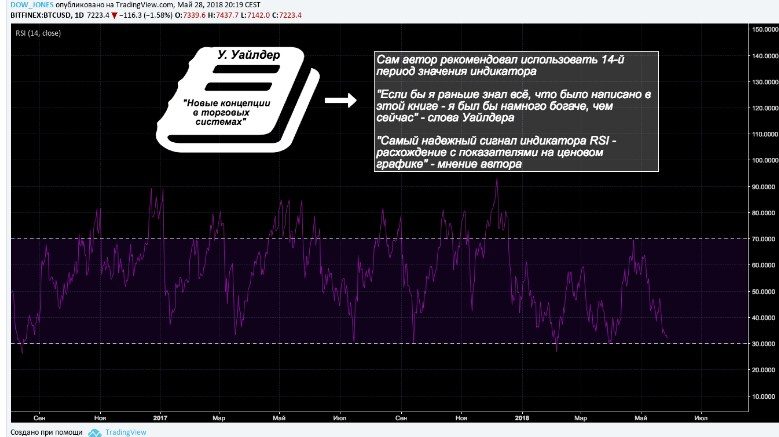
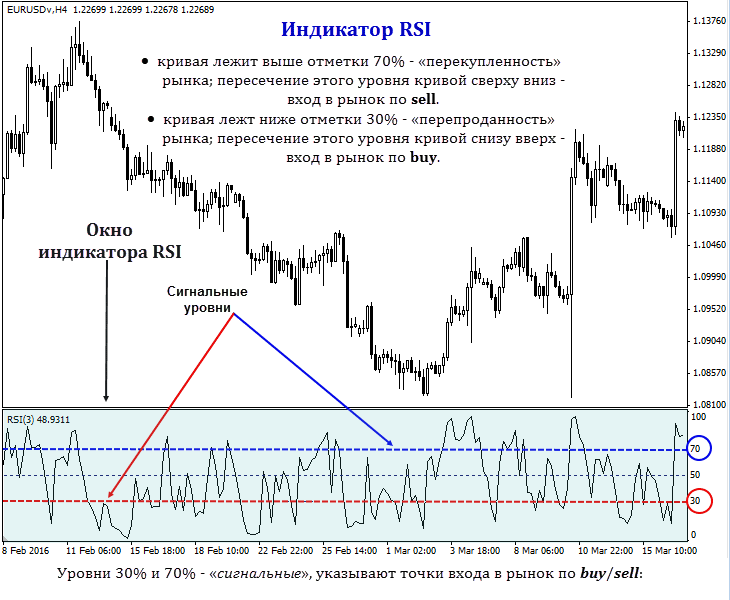
The indicator helps to establish the characteristics of price impulses without delay. An important advantage of RSI is that it is effective in almost all types of exchange markets.
The indicator calculation algorithm is as follows:
- At the very beginning, choose the type of price that you plan to use for calculations. For example, Close (the closing price) will be used.
- Let’s denote the number of the current bar as 0. We need to fix the difference between the Close prices of bars 0 and 1. This operation is performed a number of times equal to N, the dimension specified when entering the parameters.
- The results obtained should be divided into two groups. One of them (A) will have positive values, the other (B) will have zero and negative values.
- In each of the groups obtained, we must take the exponential average of these numbers. In this case, averaging occurs not by the number of elements of this group, but by N. In this case, two numbers will be obtained: the average of positive values (PS) and of negative ones (OS).
- Next, you need to get the quotient (H) from dividing the PS by the OS, taken with the Plus sign.
- To get the indicator value, you need to use the following formula: RSI = 100 – 100 / (1 + H).

- opening price;
- closing price;
- maximum;
- minimum;
- median price, which is the arithmetic mean of the sum of the maximum and minimum values;
- typical price, which is the arithmetic average of such numbers: closing price, maximum and minimum;
- the weighted price is the average of four numbers: the high, the low and the two closing prices.
How to apply the RSI technical analysis indicator, description and calculation of the Relative Strength Index: https://youtu.be/q2uDPH8MizQ The trader can choose the option that suits more. The creator of the indicator believed that the optimal calculation period is 14 bars. Now the point of view is more popular, which suggests that it is better for a trader to choose the duration specifically for the instrument used. If it is shorter, then the number of signals will be greater, but many of them are false. The success rate is higher when the period is longer. However, such signals will occur less frequently.
RSI indicator settings
To configure, you need to set the following parameters:
- Data processing period. In this case, you must specify the number of bars for which the calculation should be made.
- You need to choose which bar price should be used. This is determined by the trading system the trader is using.
- You need to set the levels, the crossing of which by the price will become a signal for the trader.
The determination of the length of a suitable period must be chosen precisely. If it is too short, then the trader will receive a large number of signals, from which it will be difficult to choose sufficiently reliable ones. With a very long duration, the indicator chart will cross the signal levels relatively rarely.
It is believed that on smaller timeframes the noise level will be higher, which may require an increase in the duration of the calculation period. It is interesting to note that the author of the indicator considered 14 to be the best period for various timeframes. Currently, 9 and 25 are also popular.
There is a rule, following which, you can empirically find the desired duration. To do this, you need to set this parameter in the indicator settings and see on the chart what signals it gave. If 80-90% of such signals are confirmed by the corresponding price movement, then the selected parameter will be effective. If this is not the case, then it is recommended to perform the same check for another number. You need to choose the right signal levels. They divide the chart into three zones. If the price crosses the lower signal level from top to bottom, then we can talk about the oversold zone. When a higher level is crossed from the bottom up, an overbought zone begins. The most popular levels are 20, 30, 40, 50, 60, 70, 80. The trader needs to choose those that he considers the most effective.
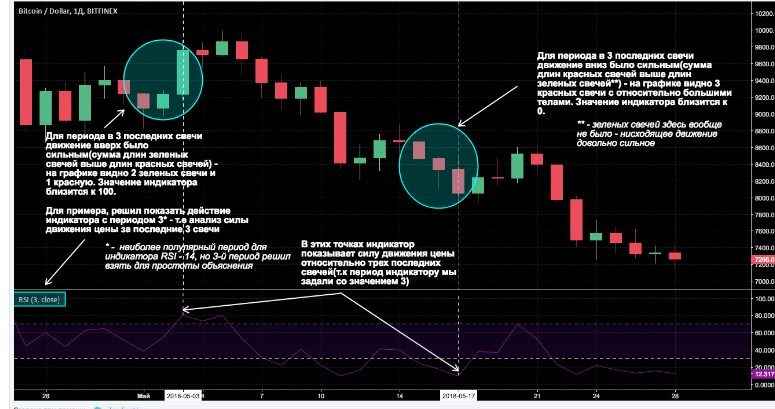
How to Use the RSI Divergence Indicator – Strategy and Rules
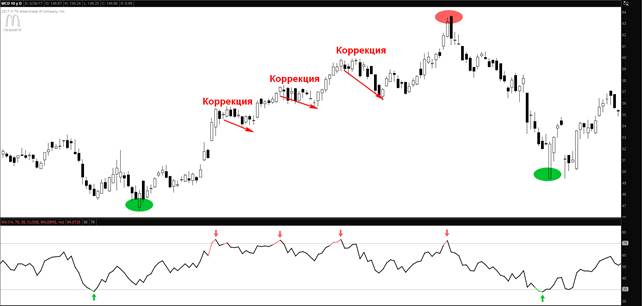
There are several ways to work with RSI. Perhaps the most famous of these is the definition of overbought or oversold. When deciding on a trade, it will be useful to examine not only the current, but also a larger time frame. If the signals are unidirectional, this will increase the likelihood of a profitable trade, and if there is a divergence, the risk of losses will increase. The most effective way is to trade in accordance with the current trend direction. In this case, only transactions in his direction are considered. For example, in a downtrend, you only need to open transactions to sell assets. In the case under consideration, the indicator signal will be the exit of RSA from the oversold zone. For the opposite direction of the trend, the signal will consist in exiting the overbought zone. In its classic form, the oscillator is most effective when used for a sideways trend. For growing, levels are used that are shifted up relative to the classical one. For a falling one, you need to move them lower.
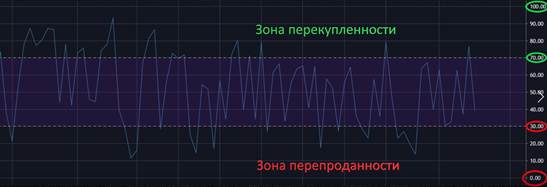

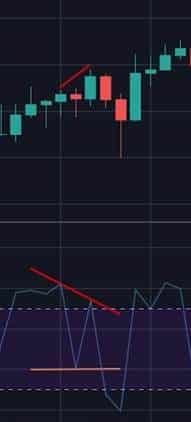
- The RSI indicator crosses the upper signal line, thereby entering the overbought zone.
- Being in it, he demonstrates a peak up.
- After a slight temporary decrease, it makes another such peak, but its height should be less than that of the first one.
- At the same time, the price goes up.
This situation suggests that the price of shares in the future is likely to decrease. In this situation, there are high chances to profitably enter a deal to sell securities. Failed Swing Formation:
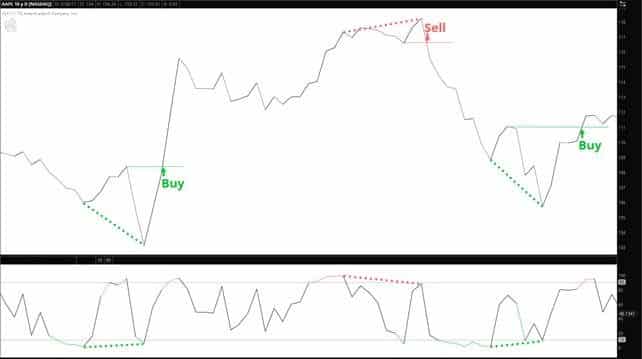
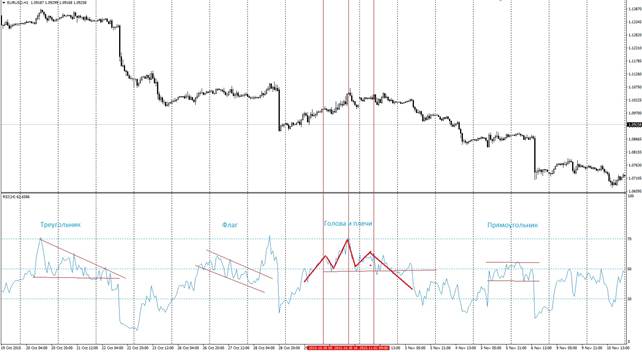
triangles , “head and shoulders” and others on it, interpreting them in the same way as on the price chart.
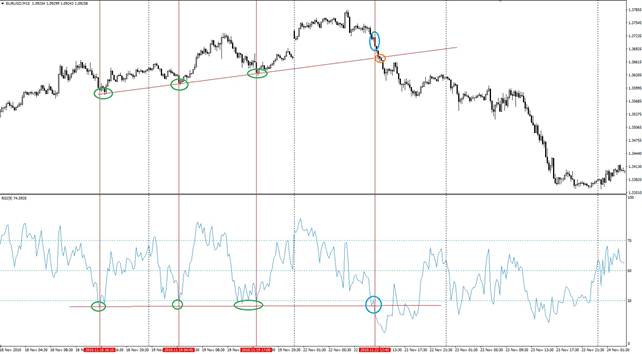
When to use RSI and when not to
The correct choice of signal lines plays an important role. It should correspond to the features of the instruments and timeframes used. Choices of 30 and 70 work well in calm markets. It can also be used on higher timeframes. If the market is bullish, then the levels will not be symmetrical. One of the suitable options is to choose 40 and 80. For a downtrend, you need to shift the levels down. For example, 20 and 60 may be suitable. It is best when the trader selects these signals in such a way that they are suitable for working with the selected instrument.
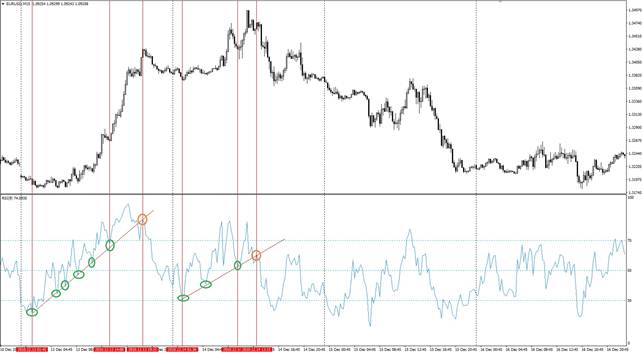
moving average may be suitable.. With their help, the trend will be determined, and when using the RSI, it will become clear when you need to directly enter the deal. Signals to enter a trade to buy stocks in a bull market:

Pros and cons
Using the Relative Strength Index allows you to enjoy the following benefits:
- This indicator allows the trader to receive reliable overbought and oversold signals for almost any type of exchange assets.
- Retains its effectiveness when applied on any timeframes.
- Can be used in any trading sessions.
- It can be used in various ways, including to determine the direction and strength of a trend, to determine the entry point into a trade.
- High speed of reaction to price behavior.
- With the correct interpretation of the indicator readings and its signals, RSI can be considered an accurate signal.
- In the course of work, the trader receives enough signals to be able to choose the most suitable ones for making transactions.
To use it correctly, it is necessary to take into account the following disadvantages:
- If the calculation period is too short, then the number of received signals will increase sharply, in which it will be more difficult to navigate. In this case, you will have to use effective means to filter them.
- With long-term trends, the indicator signals may be ambiguous.
- In this tool, line intersections are most important, but the behavior of the indicator chart in other cases can be difficult to correctly interpret.
In order to use the indicator as efficiently as possible, the trader must take into account all its important features when analyzing.

