
How to determine and what support and resistance levels mean in trading – plotting on a chart and applying in trading, trading by levels. The price moves in a zigzag manner, periodically rests against certain points – levels from which a reversal occurs and the reverse movement begins. These points are called support levels (when the price moves down) and resistance levels (when the price rises), which are fundamental concepts in technical analysis. https://articles.opexflow.com/analysis-methods-and-tools/osnovy-i-methody-texnicheskogo-trajdinga.htm Price moves between support and resistance levels. Above the price there are resistance levels of different strengths, below – support. When a technical level is broken and the price fixes, traders predict further price movement to the next level.


- Methods for determining support and resistance levels
- Horizontal levels
- Dynamic (tilted) levels
- Building levels using indicators
- Moving averages, Bollinger bands
- Fibonacci levels
- Murray levels
- Trading algorithm through support and resistance levels in trading
- How to trade in practice – strategies
- On the rebound
- For breakdown
- Terminals
- Advantages and disadvantages
- Errors in use, risks
- Testing strategies
- Manual testing
- Automated testing in Metatrader
- Testing at TSLAB
- What to read on the topic
- Jack Schwager. “Technical analysis. Full course.
- trading mechanism. Timofey Martynov
- Thomas Demark. “Technical analysis is a new science”.
- John J. Murphy. “Technical Analysis of Futures Markets: Theory and Practice”.
- Larry Williams “Long Term Secrets of Short Term Trading”.
- Bollinger on Bollinger Bands. John Bollinger.
- “New Fibonacci Trading Methods”. Robert Fisher
- “The Complete Encyclopedia of Chart Price Patterns”. Thomas N. Bulkovsky
- “Trading with Dr. Elder: An Encyclopedia of the Stock Game” Elder Alexander
Methods for determining support and resistance levels
Schematically, the behavior of quotes can be described as follows: the price moves down, at a certain moment it collides with a key level that reverses the price. The upward movement is limited by the resistance level. At a certain level, the price finds support and reverses. These zigzag movements happen all the time. The trader’s task is to identify key reversal levels, enter a trade in the right direction and close when approaching a strong level with a high probability of a reversal, or immediately after a change in the market situation. It would seem nothing complicated, but each author has his own method of constructing levels, some mark points (lines), other areas, others use dynamic levels or use indicators. It is impossible to say whose method is “correct”, as well as to determine exactly what will happen when approaching the level – a breakdown or a rebound. The trader’s task is not to “guess”, but to clearly understand what to do in each case and how to limit losses in case of an erroneous forecast. Let’s consider the main methods of constructing levels.

Horizontal levels
In trading, support and resistance levels are understood as horizontal lines that are drawn by studying the historical chart. To build key reversal levels, you need:
- open a historical chart on a day or week timeframe;
- select the “draw horizontal lines” tool;
- note the highs and lows from where there were significant price movements. It is worth noting those extremums from which there was a reversal more than two or three times;
- go to the 4h or 1h chart and do the same. There will be extremes here, which are not visible on the daily or weekly;
- go to the m15 chart and open data for the last 3-5 trading sessions;
- mark levels;
- it is better to use different colors for each period;
- horizontal support and resistance levels are built (long-term, medium-term, short-term).
Analysts are arguing about which levels to take at the maximum, or at the close. Some build on the shadows (after all, if the price was there, it means that it is necessary for some reason), others on the bodies (the closing of the candle is decisive), and still others believe that the levels are not a point, but a zone and draw a rectangle instead of a line. It is formed from several closely spaced extrema.
Dynamic (tilted) levels
Horizontal support and resistance levels work well in a flat or on large timeframes. When the price is in a trending movement, all occurring levels are broken through, and corrections are small, not reaching support. Traders draw trend lines drawn between two consecutive highs or lows to determine support or resistance levels. The trend channel is built from the trend reversal point. The line should break through 2 adjacent extremums (maximums for the descending channel, minimums for the ascending one) and an extremum between them.

Building levels using indicators
Traders believe that determining historical levels or sloping lines is not enough and is not always reliable. Indicators are used to determine support and resistance levels. Advantage – levels change with the market, volatility is taken into account.
Moving averages, Bollinger bands
To determine the levels where the price is likely to reverse, it is proposed to use indicators based on averaging historical data –
moving averages and
Bollinger bands . The figure shows on the shares of Sberbank how EMA233 on the hourly chart holds the trend. It acted as support for an uptrend, after a breakdown and a test, a downtrend began, which ended only after the price fixed above the moving one. At the same time, traders who entered a trade on the test of the moving average could move the stop following the market without being tied to levels that are no longer relevant. After each touch and rebound of the price, it was possible to open new transactions according to the trend.


Fibonacci levels
The tool is based on the Fibonacci sequence. Each number is the sum of the previous two, dividing any number by the previous one gives 1.61. To predict key price reversal levels using Fibonacci levels, the instrument is tied to an existing trend. You can predict a correction or further development of the trend. The trend correction is usually 23-38%, when the extremum is broken, the price usually reaches 128 or 161%.

Murray levels
To predict the price, a system was developed that combines Fibonacci levels and the Gann square system. The levels are built automatically based on the last 64 candles of the selected timeframe (the period can be changed). The indicator is available in the Tradeview service or the Metatrader terminal (Match Murrey). The constructed grid consists of 8 levels, they are rebuilt if the volatility changes or the price goes beyond the square.

Trading algorithm through support and resistance levels in trading
Support and resistance levels show the behavior of a large number of participants (“crowd”) on the chart. The price consolidated at the price level, the forces of bulls and bears are equal in the absence of news. Participants are divided into 3 groups – those who bet on the growth, on the fall and undecided. If some news comes out and the price goes up sharply, then those who sold understand their mistake and dream of closing the deal at breakeven if the price returns. Those who bought want to buy more, and those who were out of the market decide what to put on growth. Therefore, the initial impulse is developed. Many people study technical analysis, learn to work on trend lines, then set the same indicators, put stop orders behind important extremes.

- reversal zones on the historical chart on a period not lower than a daily one, preferably on a weekly or monthly basis;
- levels that are formed on increased volumes;
- levels that are formed by “news” candles. For example, the President of the United States is giving a speech and an asset is impulsive. After some time, in the absence of news, the price decreases, but does not cross the opening of the news candle, bouncing off the level each time it approaches. This level can last for more than a year.
How to trade in practice – strategies
When approaching the level, the price may bounce back “on a rebound”) or go further. (“for testing”).
On the rebound
The trader builds a grid of levels in the terminal, with each approach to a strong or medium strength level, a deal is opened in the opposite direction and held until the next level. If the price approaches the resistance level, shorts are opened, and longs are opened on supports. This method of trading is common in flat markets, in intraday trading, or when it is clearly visible that the asset is in a range.
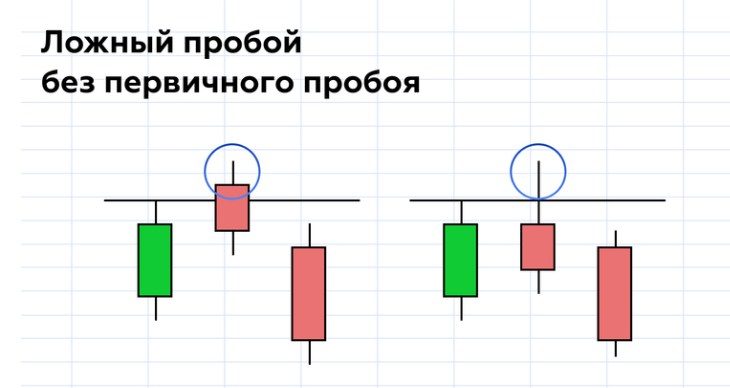
For breakdown
The trader waits until the price breaks through the level and consolidates higher. Fixing is considered to be the closing of the candle of the traded period above the level. A trade is opened in the direction of price movement. The trader builds a trend channel, and opens all new deals in one direction upon breaking through each next level, as long as the trend is in effect.

Terminals
Regardless of which market (stocks, metals, raw materials, etc.) a trader trades in, the psychology of the participants does not change. So the levels work. Therefore, any terminal has basic drawing tools – horizontal and trend lines, rectangles, channels, Fibonacci levels. Moving averages, Bollinger bands, etc. are included in the standard package of indicators of any terminal. If the required functionality is missing, or it seems inconvenient to build a grid of levels, you can use the free Tradeview service.

Advantages and disadvantages
The use of resistance and support levels in practical trading has its pros and cons. Advantages:
- the system works in any phase of the market – there is no difference between a trend or a flat, if used correctly, the levels will help predict further price behavior;
- a clear risk – when trading by levels, it makes no practical sense to be in a deal after a breakdown and fixing the price behind the level. You can put a clear stop and set the amount of losses in advance;
- a well-defined take profit – exiting the trade is no less important. When trading from level to level, it is immediately clear where to exit the transaction. Take profit is calculated in advance.
Flaws:
- a trader can start fantasizing “and the price of a hundred pounds will rebound”, “well, we’ll definitely break through”. The levels are based on the behavior of the crowd, and in manual trading, the trader is part of this crowd;
- the efficiency of working out the levels depends on the phase of the market – a trend or a flat, the levels do not give an answer to this question, for this you need to use additional tools.
Errors in use, risks
A common mistake for beginners is a combination of a large number of methods for constructing reversal levels. As a result, the chart looks like a continuous grid of levels, but this does not bring any practical benefit. The trader does not know how to react if the levels are so close, there is a 100% chance that there will be a reversal from some line. There is no magic in this. The trader decides that the line from this method is the strongest, and the next time there is no reversal. With excessive confidence in the transaction and the absence of a stop loss limiting losses, such trading very quickly leads to a drain on the deposit.


Testing strategies
The pullback and breakout trading methods describe only the general principle. The trading strategy should include:
- a clear rule of definition of support and resistance levels. You need to choose one or 2 ways to build levels and follow them;
- clear rules for entering a trade – entry for a breakout or a rebound, under what conditions;
- filter – you need an additional indicator, technical or fundamental, which can tell you whether it is worth opening deals. There are no trading systems that work equally well in all phases of the market. If there is a trend trading for a breakdown, the flat market will lead to losses;
- risk management – you need to clearly define the size of the stop or the conditions under which the transaction will be closed;
- take profit – clearly define the closing rules.

After formalizing all the rules, you can analyze the profitability of the strategy on historical data. It is better to check 5-20 years, the markets are cyclical, if the system shows good results now, you need to know if there were unprofitable periods in history and how long they lasted. Based on the results, you need to draw a conclusion about the effectiveness of trade. Maybe you can change some parameters to make trading more profitable. Sometimes it is enough to change the period of the moving average or increase the stop to significantly increase the profitability of the trading system.
Manual testing
Strategies with graphical construction on large timeframes can be checked manually. It is necessary to check at least a year, preferably 5-10 years. To do this, you need to set the necessary indicators and scrolling the chart to the right to look for signals and record the results of virtual trading. In order not to peep “into the future”, you can use a trading simulator, for example, in the Tradeview service. To do this, open the chart and click the “Market Simulator” button at the top of the screen. You can select the start time of the simulation (vertical blue line) and the speed at which new candles will appear on the chart.

Automated testing in Metatrader
To test the strategy in the Metatrader program, you need to write an adviser. If there are no programming skills, you can turn to specialized services, for a simple adviser they will charge $50-200. Next, we want to enter the program and click “Strategy Tester”.

Testing at TSLAB
If you have no experience in programming, you can test strategies for free in the TSLAB program.
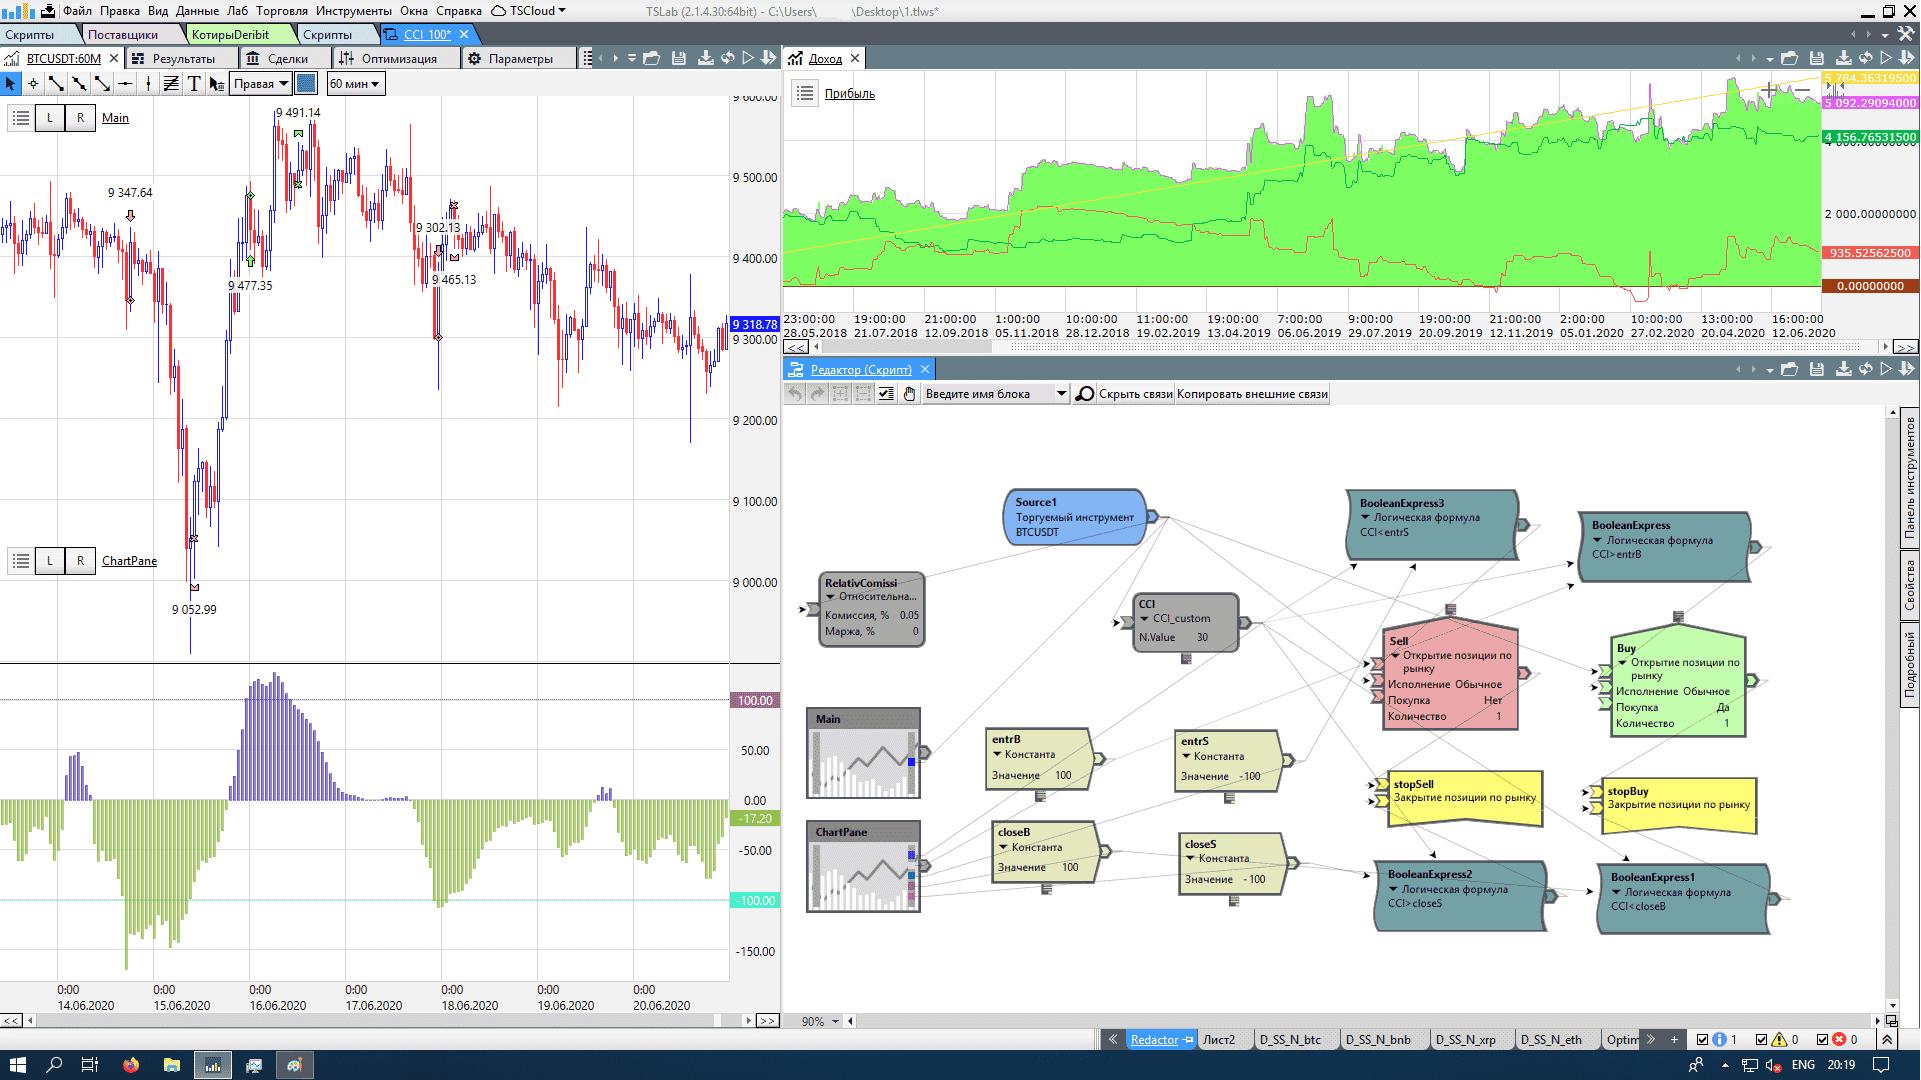 You still have to figure it out, but you don’t need special skills to work with application cubes, enough knowledge for high school and perseverance. To test the strategy you need:
- Download and install the TSLAB program.
- Download historical quotes in .txt format, for example, from the Finam website https://www.finam.ru/profile/moex-akcii/gazprom/export/ .
- Create an algorithm in the TSLAB program and test the strategy.

What to read on the topic
During the formation of a trader, it is useful to read someone else’s experience, many famous traders shared their experience. Famous traders talk about their journey, research and technical analysis methods. Some of the best books on technical analysis from well-known authors – traders, analysts and investors:
Jack Schwager. “Technical analysis. Full course.
The classic book of technical analysis, a well-known trader talks about the analysis of charts, methods for understanding price movements. Shares his experience, analyzes specific situations. The construction of trend lines, ranges, support and resistance levels and indicators is described. The author gives advice and practical remarks on trading and risk management.
trading mechanism. Timofey Martynov
The author is the creator of the popular site for traders and investors smart-lab.ru. For more than 10 years, he has been following the behavior of the market, and was a presenter on the RBC channel. Unlike other authors, real examples of losing trades are given. Martynov describes his experience of loss-making trading for 5 years. He shares the secrets of how he managed to change the approach to trading and start making good money. Recommended reading for novice traders.
Thomas Demark. “Technical analysis is a new science”.
Demark devoted 25 years of his life to studying the behavior of stock markets. He outlined all his experience in this book, tells the main aspects and problems of technical analysis. Shares his own method of constructing oblique lines. The author argues from a scientific point of view, in trading there is no place for speculation and an intuitive approach. All reasoning of the author is proved empirically.
John J. Murphy. “Technical Analysis of Futures Markets: Theory and Practice”.
This book is a classic of technical analysis. The author is a recognized guru of technical analysis, a talented trader and investor. In the publication, the author tells about technical analysis, its conceptual essence, methods of its application in practice. Murphy talks about why these methods work, the profitability of the method is calculated. .
Larry Williams “Long Term Secrets of Short Term Trading”.
Day trading is one of the most profitable and complex methods. The author, one of the most successful traders of the 20th century, shares his personal experience, shows patterns and strategies by example. He talks about the phases of the market, touches on the topic of risk management. https://articles.opexflow.com/analysis-methods-and-tools/svechnye-formacii-v-tradinge.htm
Bollinger on Bollinger Bands. John Bollinger.
The author is the creator of the indicator, which is in every terminal. Recommended reading for anyone who decides to use Bollinger Bands. Who, if not the author, will tell about the nuances of the application and the meaning of the indicator.
“New Fibonacci Trading Methods”. Robert Fisher
The author proposes a new method of using a popular tool. The book analyzes the essence of the concept and reveals its practical meaning.
“The Complete Encyclopedia of Chart Price Patterns”. Thomas N. Bulkovsky
A classic of technical analysis, many famous traders of the early 21st century studied from this book. Contains the most complete theoretical information about graphic models. The book presents trading statistics, describes the advantages and disadvantages of the model. The publication will be useful to read to private investors and speculators. Not even to put into practice, as for general development.
“Trading with Dr. Elder: An Encyclopedia of the Stock Game” Elder Alexander
The author is a world famous technical analysis guru. The book contains the experience of the author, provides an analysis of specific situations. It is important that the author tells how to organize trading and draw conclusions from mistakes. Trade diaries show the author’s thought process and allow you to track the ups and downs. At the end of the book there is a test with answers that will help you understand if the reader is ready for trading.


