
One of the main tasks of a professional trader is to predict the price of the assets used. For this, there are special mathematical models that take into account the current market trend, as well as a possible deviation from the original rate. All this is the basis of any conservative investment policy. But also many traders use candlestick formations in trading. With their help, you can predict the trend in price. And most importantly, there is practically no need to use complex mathematical formulas. Instead, graphical analysis is predominantly used, which significantly speeds up decision making for the trader. At the same time, candle formations can be used both in short-term purchases and long-term investments in assets.

Reading candlestick formations
Before you begin to understand how
candle formations work and form , you need to learn how to “read” them. Conventionally, each candle on the chart consists of “departments”:
- the upper vertical line indicates the maximum trend, that is, the value of the asset for the specified period of time;
- the upper horizontal line (rectangle edge) is the closing/opening, or the maximum price at the beginning of the calculation period;
- the lower horizontal line (rectangle edge) is the opening/closing or the minimum price at the beginning of the calculation period;
- the lower vertical line is the minimum price of the asset.

- “Bull” . The rectangle is white or unfilled. That is, when the price at the opening of a position was lower than the closing cost.
- “Bear” . Everything is exactly the opposite with respect to the “bullish”. That is, the cost at opening a position was higher than the price at closing.
It can be immediately noted that a chart with candles provides a potential trader with much more information for analysis than a regular falling or rising line. That is why experienced investors most often use candlestick formations when working with terminals, similar to Metatrader. A trader can set the candle formation interval at his own discretion. It can be 1 minute, 1 hour, or 1 month. It all depends directly on his individual pricing policy.

The main advantages and disadvantages of candlestick charts
The obvious advantage is more visual information for further analysis. And candles in the long term can indicate the current trend without the need to resort to full-fledged technical analysis. This is true for both short-term and long-term positions. The second advantage: the information obtained from the candles is enough for semi-automatic trading using
bots. But there is always a risk of breaking through positions, so leaving a stop loss is a must. Every trader needs to be prepared for a sudden change in the situation in the open market. And the only significant drawback is the lack of chart smoothness, which makes it difficult to optimally open positions (exactly at the top or bottom), especially when trading with a large gap. But most brokers even out this minus by adding the so-called “moving average” to their payment terminals, which is automatically calculated based on the basic chart with candlestick formations. This just makes it possible to evaluate the trend for the exact period of time (which the trader is interested in). And experienced traders assure that they do not have a special need to use a moving average. Like, having the proper experience, it is perceived on a subconscious level. But this option is no longer for beginners. 
Types of candlestick patterns
It should be noted right away that candlestick patterns are more related to mathematical and technical data analysis. Accordingly, they do not take into account third-party events that affect the pricing policy of assets. There are many patterns, and traders continue to compose them today. But for those who are still at the learning stage, it will be useful to learn a few of the most popular ones:
- Full bodied bullish candle . Indicates that a bullish trend is expected to continue in the coming period.
- Full bodied bearish candle . Indicates that a continuation of the bearish trend is expected in the near future.
- Doji . That is, when there is no candle as such, because there is no difference between the opening and closing in the interval. Experienced investors recommend refraining from any transactions during this period, that is, if possible, not participating in the market.
- Hangman . Indicates high volatility of the asset. This will most likely be followed by a downtrend.


Classic candlestick formations for trading
Every trader has their own trading style. And this is just influenced by their own individual vision of trends. And here the most important thing is to catch the “rhythm” that will not contradict the basic market trends. That is, you need to develop your own strategy, according to which operations will be performed. For example, many traders close trades only after the appearance of “three white soldiers”. This is a conservative approach, but only works with highly volatile assets for short trades. And there are several such generally accepted strategies that you can use to create your own unique:
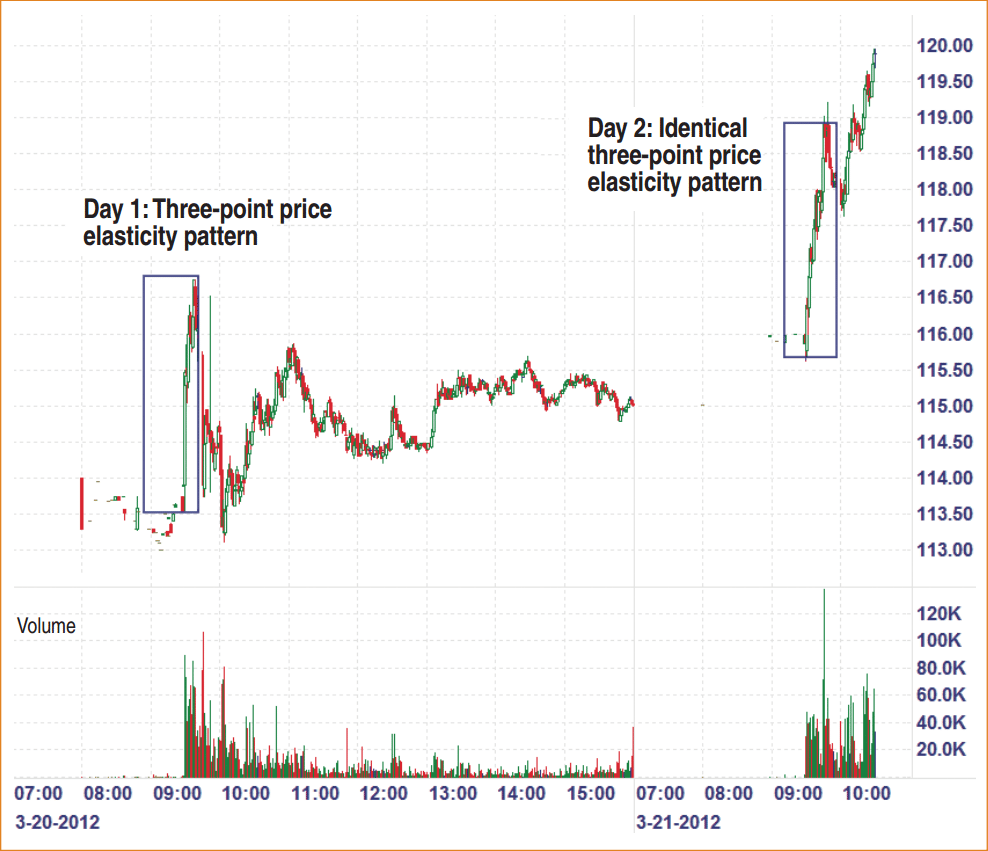
- Breakout within the day . Most often associated with any news that affects the investment background of the entire market. Accompanied by a long gap up or down. As a rule, this happens in the morning, when the market just opens and prices are corrected. The trading range itself is formed in the interval from 9:30 to 9:50 (GMT). And immediately after that, it is recommended to open orders, that is, from about 9:50 and in the next 20-30 minutes. Then you need to form a target profit (for each asset – individually), place an automatic order (stop). The only caveat: if after 11:00 a trade does not show a profit, then you should consider the option of forcibly closing it, even if a loss is recorded.
- Trading against breakout. Here it is important to be able to fix those breakdowns. This is often preceded by a hammer candle formation.. You should not “react” to each of the breakdowns and immediately open or close an order in such a situation. This in most cases ends up with the percentage of successful transactions not exceeding 50%. The general rules of trading in this case: the asset makes a gap up or down with an active breakdown. Next, you need to wait for the trading range (from 9:30). If before 10:00 there is a further gap in the same direction, then the breakdown cannot be completed. Otherwise, you need to make a deal in the period from 9:50 to 10:10 in the opposite direction (that is, against the breakdown). The return is high, such a formation works especially well with volatile assets, that is, the price of which changes dramatically in each trading period.
Candle hammer - Trade range . It is a good option for trading between 11 am and 2 pm. For this period, it is necessary to form the upper and lower ranges, between which the main fluctuation in value occurs. And it is when the candle goes to the lower border that you should open a deal. The sale is carried out “at the top”. You can use automatic stops by subtracting the commission deduction and leaving an acceptable profit for yourself.
- Breakdown at the end of the day . It is used in the interval around 14:00 in the afternoon, that is, when the market closes. Volatility naturally rises at the same time. The task of the trader is to fix the position when the price “leaves” the morning range (value range). It is at the beginning of such a trade that you need to open a deal. It is also recommended to place a stop loss on the price rollback, especially when there is a risk of external control of the price of the asset (for example, the next payment of dividends in the case of stocks or artificial regulation of the value of currencies due to interventions).
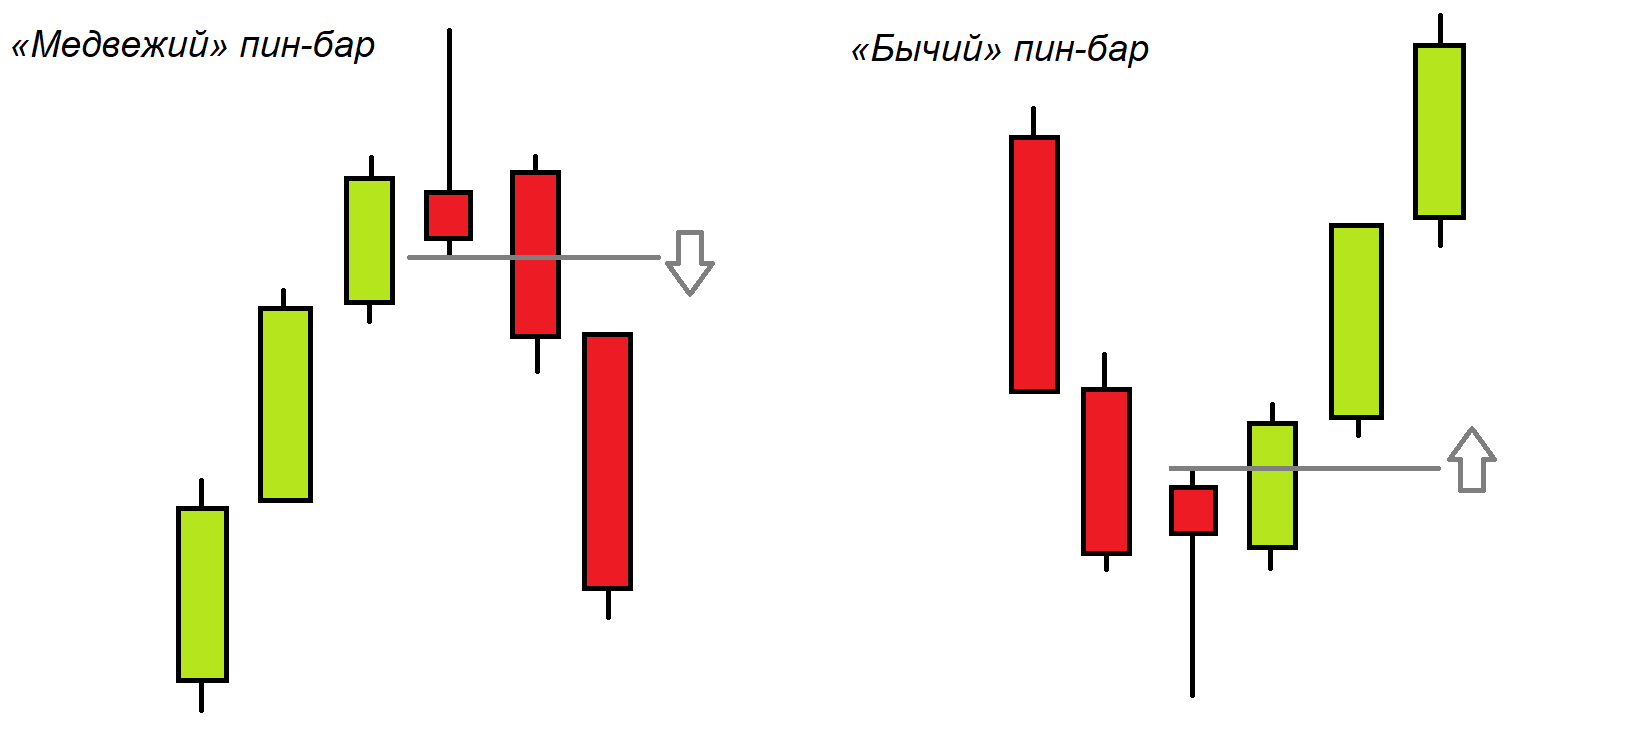
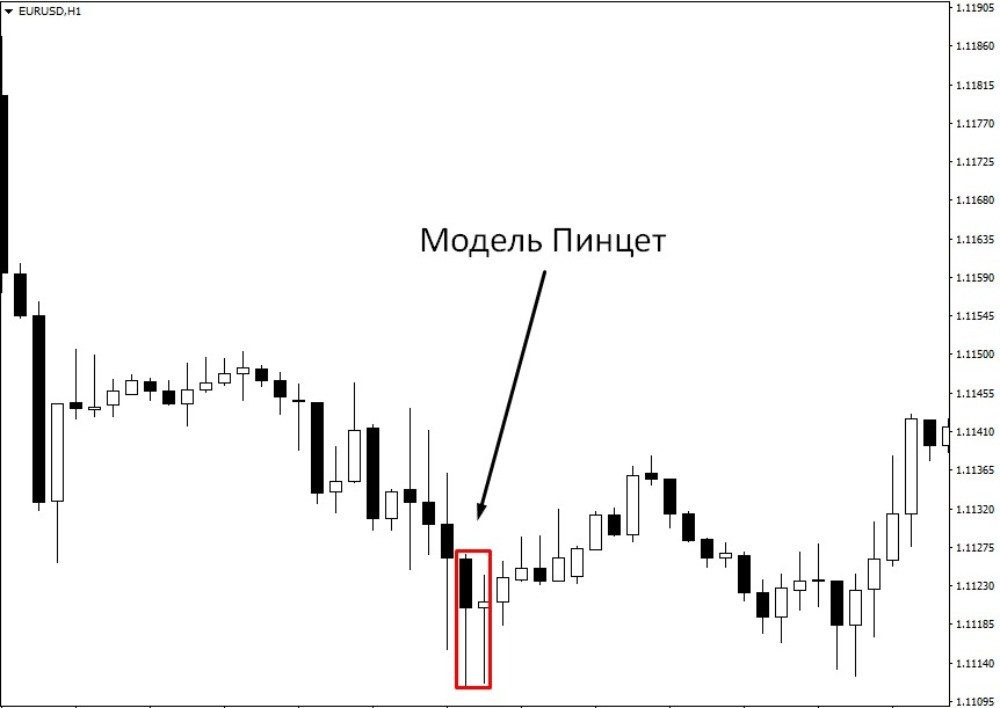
- Formation tweezers candle . Another popular strategy. And it is a variation of reversal candlestick formations . The time period is not taken into account. “Begins” from the moment when there are three candles in the same trend with a long shadow. The first indicates, for example, an uptrend with a tall shadow. The second is the same, but at the same time its trend does not exceed the shadow of the first. In this case, the probability that the third candle will go in the opposite direction is very high. Accordingly, you can make both opening and closing orders.
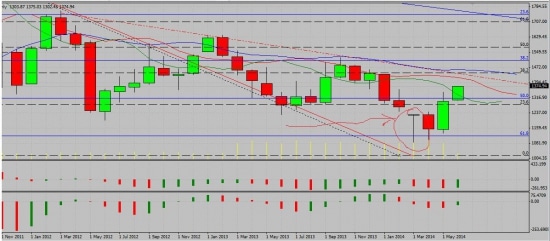
- Formation cup with handle candle . It is calculated on relatively long periods, capturing at least 10-15 candles. Shows the overall level of market resistance. Breaking through this level just indicates a stable trend (to increase). The pattern is great for working with non-volatile assets, that is, when the price fluctuation is insignificant. By the way, there is a similar “inverted bowl” pattern. It also signals a downtrend.


Pattern Compliance
Again, there are many such patterns. The task of a trader is to be able to evaluate candle formations separately for each asset with which he works. This allows you to develop an experience by which you can predict a further increase or decrease in value. In summary, candlestick formations are both a simple and effective tool for quickly assessing a trend. But it can be used in many complex strategies. There are more than 10 thousand of them, it is impossible to study all of them. A trader just needs to have a basic understanding of them in order to form their own formations.


