
Bullish and bearish divergence in trading – how it looks on the charts, trading strategy. Opponents of the indicator analysis of the market consider the delay of indicator signals from the movement of quotes as the main argument “against”. However, when it comes to divergence, this lagging feature helps to find profitable and reliable entry points.

- What is divergence in trading
- Types of divergence
- Classical divergence
- Hidden divergence
- Extended (exaggerated) divergence
- Convergence
- Features of the formation of divergence on various indicators
- Stochastic Oscillator
- RSI – relative strength indicator
- MACD
- Trading Rules
- Divergence in trading: how to open trades correctly
- Opening trades during bearish divergence
- Opening trades during bullish divergence
- double divergence
- Divergence and price action
- At the end – theses
What is divergence in trading
The term “divergence” comes from the English word “divergence”, which translates as “divergence, discrepancy”.
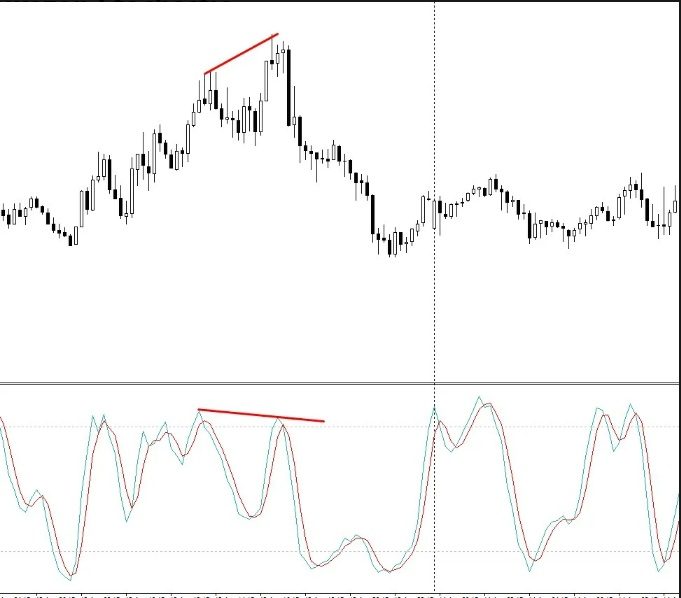
Divergence in trading is the discrepancy between the indicator readings and the movement of quotes. For example, a divergence occurs when the price continues to move in accordance with the trend and makes a new high, and the oscillator gives signals of a weakening trend, i.e. on the chart, each subsequent maximum is lower than the previous one. Divergence heralds a stop, correction or trend reversal. In other words, this is a critical point, at the onset of which you need to make trading decisions.
Types of divergence
There are three main types of divergence:
- classical;
- hidden;
- extended.
Each of these types, in turn, is divided into two types:
- bearish – formed on an ascending chart and indicates a price drop in the near future;
- bullish – occurs on a downtrend and portends an increase in price.
Classical divergence
This most common type of divergence occurs just before a trend change. For example, to identify a classic bullish divergence on a chart, you need to watch the lows and set the moment when the indicator chart will form a higher low and the price will update the lowest low.

Hidden divergence
Unlike the classical one, a hidden divergence appears when the oscillator makes a new high or low, and the reaction of the price movement is weaker, the market remains at the stage of correction and consolidation. This signal indicates the continuation of the current trend and its likely consolidation. The appearance of a hidden bearish divergence indicates that the price will continue to fall. Hidden bullish divergence indicates that the price will continue to rise. Hidden discrepancy is difficult to detect, but should not be neglected. A weak pullback of the oscillator is an excellent signal to open or close trades.

Extended (exaggerated) divergence
Extended differs from the classic divergence by the formation of two almost identical highs or lows on the price chart. This is a signal to continue the current trend. Trader-analysts specify that the constructed peaks (or low points) do not have to be located at the same level. The main indicator of extended divergence – the indicator chart, unlike the price chart, does not form double extreme points.

Convergence
The term “convergence” is translated as “convergence”. Convergence is depicted on the charts by two converging lines (price and indicator). Translation of English terms and specific exchange slang can be misleading for a beginner. So, let’s define the terminology: divergence is the discrepancy (divergence) of the movement of the indicator and price charts; And also the discrepancy on the chart can be depicted by converging and diverging lines (bullish or bearish). Thus, convergence is called bullish divergence.

Features of the formation of divergence on various indicators
Divergence is formed on all types of indicators, but there are separate models on which the divergence is easier to determine. Each of these tools can be used effectively in thoughtful strategies.
Stochastic Oscillator
Stochastic sometimes gives false signals, so only the strongest of them should be taken into account. One such strong reliable signal is the divergence of price and indicator charts. An additional confirmation is the intersection of the stochastic lines. The main advantage of the Stochastic Oscillator is that it clearly shows all types of divergences. To determine divergences, it is recommended to increase the deceleration in the settings. This will smooth the lines, the signals will be less, but they will be more reliable.
RSI – relative strength indicator
The RSI divergence trading signal matters when one of the extremes is formed in the overbought zone (in the range of 70 and above) or oversold (in the range of 30 and below). Usually this indicator reverses earlier than the price. https://articles.opexflow.com/analysis-methods-and-tools/indikator-rsi.htm On the basis of RSI, a more reliable and convenient arrow oscillator RSI_div. was created, focused on determining long price movements. The green arrow shows buy entries, the red arrow shows sell entries. RSI_div is especially effective on higher timeframes (from D1).

MACD
MACD, as a trend indicator, steadily follows the current rate without long periods of erroneous signals. To identify divergences, a linear MACD is usually used, but for some strategies, using histograms is a convenient option.
Trading Rules
The following points should be taken into account:
- Watch out for price extremes.
Divergence is only defined if the price makes a new high (low) or forms a double top (double bottom). In the absence of these points on the price chart, you can ignore the indicator chart.
- Connect peaks.
With a bearish divergence on the price chart and on the indicator chart, only the highs need to be connected. With a bullish divergence, only lows are connected on the price chart and on the indicator.
- Draw verticals.
The extremum points of the price chart and the indicator chart should coincide. To check compliance, it is recommended to draw vertical lines.
- The slope angles of the lines indicate the strength of the divergence.
The greater the angle of inclination of the lines, the stronger the divergence, which means the greater the chance for a trend reversal.

- Confirm the divergence.
The best confirmation of divergence is finding extreme points in the overbought or oversold zone.
- Don’t miss a moment.
You can not miss the entry point into the transaction. If the moment is missed, then it is useless to catch up with it, the divergence has worked out and has become irrelevant. In this case, it is better to wait for the next divergence.
- Not sure – don’t trade.
You should not guess on the coffee grounds and build hypotheses about whether a discrepancy has occurred or not. A real and reliable signal must be clear and understandable.
Divergence in trading: how to open trades correctly
There are many strategies for trading using the definition of divergence, but they are united by the general principles of opening trades.
Opening trades during bearish divergence
When the price chart draws a new higher peak, and the oscillator does not confirm this, a signal to open a sell position occurs. At the same time, anti-trend signals are often received, which is a reason to exit the transaction. It is necessary to open new transactions against the trend as carefully as possible, it is better to do this when a divergence forms during a period of consolidation or correction.
Opening trades during bullish divergence
The appearance on the quotes chart of a new lower low, which is not confirmed by the oscillator, is a signal to open a buy deal. If the signals are directed against the trend, it is recommended to close sales. Divergence – how and when to use it: https://youtu.be/kJQu999pt_k
double divergence
If we talk about the strength of signals, then a double divergence is a stronger signal than a single one. A double divergence can be defined as a series of extremes that are not confirmed by an oscillator. The MACD screenshot below shows a double bullish divergence: the waves of the price chart become smaller each time and gradually weaken. The indicator shows several divergences, but the first single divergence would be losing. In this case, you should not rush, you need to wait for a new high, which will indicate a reversal in the price trend.


Divergence and price action
The price action strategy involves trading using only the price chart, without indicators. In this case, the term implicit divergence is used. Let’s look at an example on a candlestick chart. The screenshot below shows the moment of weakening of the price rise: the candles close in the range of the values of the previous candles, the shadows lengthen. There is a strong level of resistance.


At the end – theses
- Divergence is a fairly reliable signal to open and close trades.
- The divergence of the signals of the price chart and the indicator chart does not always indicate a trend reversal.
- Divergence, like any other signal, requires verification, so for reliability, it is recommended to use several indicators. A reliable confirmation of the signal is the exit of quotations beyond the overbought (oversold) levels.
- Divergence can be determined without indicators (price action strategy).
- It is better for beginners to use large timeframes (from H1 and higher), they give more accurate signals.


