
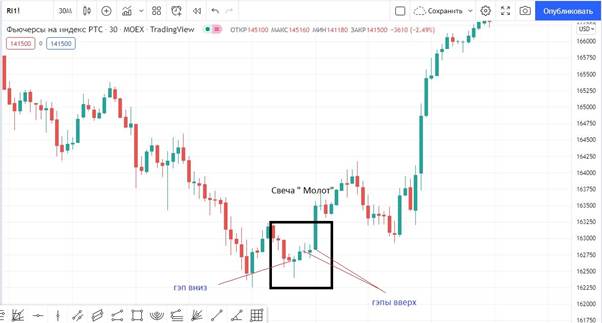
Japanese candlestick “Hammer” – construction, description on the chart and application in trading. The hammer is a single candlestick reversal pattern shaped like a hammer hanging on a wall. Feature – the candlestick has a long shadow, exceeding the body at least twice. The appearance of this pattern tells the trader to prepare for a market reversal up.

Hammer indicator features
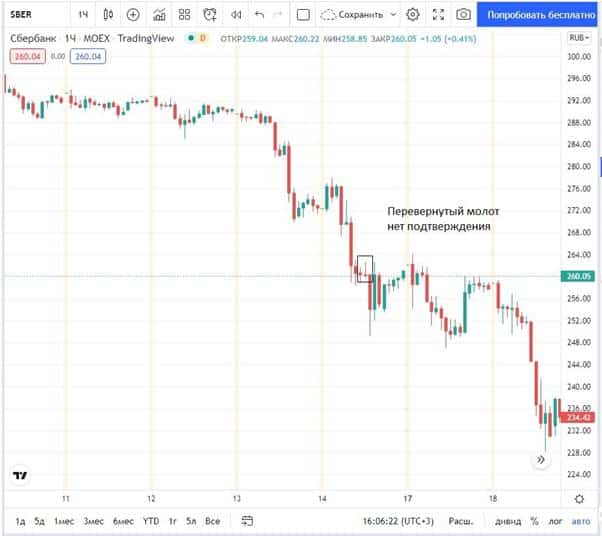
The hammer appears only at the bottom of the market, after a long downward movement. If a trader notices a hammer at the top of the market, then he should not regard it as a signal to buy. The hammer at the top of the market is called the “hanging man” and speaks of an imminent price decline. 
- a small body, close in shape to a square;
- the shadow exceeds the body by more than 2 times;
- there is practically no second shadow;
- the shadow can be both below and above (then the pattern is called an inverted hammer);
- formed on a downtrend;
- high volatility – the hammer should have a significant distance between the minimum and maximum, more than 2-3 neighboring candles


The power of the pattern
Not every hammer works out as we would like – our entry is at the beginning of a trend movement. There are several signs by which a trader can characterize the strength of the pattern:
- white body – in intraday trading adds confidence in the transaction. The bulls are so strong, but the bears don’t have enough power to control the candle;
- the hammer is formed at increased vertical volumes;
- gaps – the opening of a signal candle occurred with a gap, the bulls, after a short respite, seized the initiative and pushed the price strongly;
- the pattern is formed at a strong support level, while the price does not fix lower;
- timeframe – the pattern can be found on any timeframe, the higher the period, the more reliable the pattern. The highest percentage of mining is at the hammer on the weekly chart;
- after the hammer, a strong bullish candlestick is formed;
- there are additional signals from the indicators, a good entry will be obtained if the hammer is formed simultaneously with the divergence on the RSI or AO indicator. It is worth paying attention to the signals on the timeframe above 1 hour.

Hammer candle in technical analysis: https://youtu.be/Dt2ItrqNGn0
How to trade a candle – hammer pattern in trading in practice
Traders encounter the hammer and inverted hammer candlestick pattern in all markets, whether it is stocks or oil or gold. You can trade them on any period, but it is recommended to use a larger timeframe. There are several reasons for this:
- reliability – the higher the period, the greater the probability of mining;
- volatility – 4 hours and even days more price range and there is a chance to enter at the beginning of a trend that will last at least a week;
- risk profit ratio – it is necessary to maintain at least 1 to 3 between the stop and take profit. It is difficult to do this on a minute chart, on this method the most common ratio is 1 to 1;
- for additional confirmation, you can use a cluster chart or a chart of horizontal volumes . A good signal has volume in the shadow of the hammer.
If trading is carried
out intraday, in which the deal is necessarily closed at the end of the day, signals can be searched for on m15-m30. There will be more transactions, but their quality is worse. With such trading, the trader must be prepared for frequent losses. Hammer on the daily or weekly charts rarely occurs, sometimes you have to wait a month or longer for a trade. And the transaction itself can last a week or a month. In order to receive more signals, a trader must monitor the charts of many instruments. Trading is more measured and after the appearance of the hammer, there is another 1-2 days to make a decision to enter the deal. Decisions in intraday trading must be made quickly.
Trading algorithm
- The market is in a strong downtrend, at least a week.
- The price is approaching a significant support level. There are prerequisites that this level may turn out to be the minimum of the market for some time.
- A hammer candle is formed at the level.
- Below the support level, the price went only with a shadow. There may be 2 or 3 hammers on the same level. This amplifies the signal. Bulls are strong enough to keep price closes above support.
- After the hammer, there is confirmation – a strong bullish marubozu or doji candle. It is important that the price does not fall below the support with the body.
- Open a buy trade just above the high of the candle.
- Stop loss is placed behind the shadow.
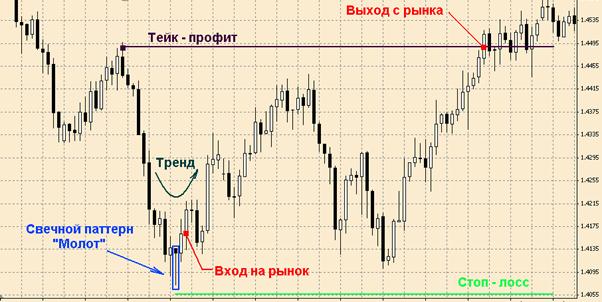
- Take profit is set at a level that is 3 times higher than the stop. Or more.
- If the hammer candle has a very large shadow, stop loss can be placed just below the opening of the candle.
- If, after entering a trade, the price does not show strength – it slowly falls and stands still, the trader prefers to exit the market after the breakdown of the short-term trend line and wait for the situation to be resolved.
- If the hammer has a long shadow and the trader wants to get a better risk-reward ratio, you can set a notification when the price returns 50% of the shadow. You can put a limit order on the level. Or switch to a smaller timeframe and try to find another hammer at the level. The stop is set below the low of the candle. Take profit in this case is set as 10x from the stop.
- Often a new trend starts with a hammer on a daily or weekly chart. After reaching the take profit, the stop is moved to breakeven and not all, but only part of the position is closed. It is preferable to close more than 50% of the position. The remainder can be held until the opposite signal appears (hanging) or by moving the stop into the profit zone.
- After confirming the trend change and reaching the take profit, the position is not closed. The stop loss moves to the safe zone and another asset is bought. You can buy the same volume or 2-5 times smaller. The main rule is that when the stop loss is reached, the risk does not increase. Ideally, the stop would only stand at breakeven. Take profit is not set, the trader monitors the market and, when a signal for a long occurs, opens new trades and moves the stop. Exit from the transaction – in manual mode when a reverse signal appears or when the stop loss is reached. The transaction can be both short-term and last for several days or even months.


Hammer trading mistakes
Traders who start trading the hammer on the chart often quickly become disillusioned with the pattern. It seems to them that it does not provide an advantage, it works 50/50. Traders, when trading on the hammer, make the following mistakes:
- look for a pattern on weak support, anywhere on the chart, and not at the bottom of the market;
- enter a trade without confirmation on a strong downward movement;
- the volatility of the hammer is low – the price range should be higher than that of the neighboring 2-3 candles. This concept is subjective, and even a bad hammer can work out, but the psychology of the pattern is the answer to a strong attack. If there was no attack, then there is nothing to beat off;
- small shadow or too large body;
- they take for a hammer similar candles, but with large candles on both sides – doji. Doji is a figure of uncertainty, while the hammer shows the victory of the bulls in the moment;
- the concept of bottom and top of the market – subjective. It is very dangerous to trade the countertrend in a falling market . The price can make only a small bounce, which is not enough to reach the take profit level, and continue the downward movement. A trader trading with a table may make 2-3 or more unsuccessful trades in a row;
- if the ratio in transactions is 2 to 10 and higher, for profitable trading it is enough to make more than 1 profitable transaction out of 10. The main mistake is psychology, the desire to stop losing. Traders remove stop loss, this leads to big losses;
- Another common mistake is taking profits at a ratio of less than 1 to 3. Traders should understand that this approach is unprofitable at a distance. Even if at the moment they experience pleasant emotions from a profitable transaction.


The hammer is a candlestick pattern that is easy to see on the chart. It can help a trader predict future price action. However, trading solely on hammers, if a trader trades with a risk reward ratio of less than 1 to 3, can be unprofitable. It is necessary to seek to increase the risk-reward ratio. To increase the probability of a successful transaction, you need to use additional confirmation – the following candles, indicator readings or information from a cluster chart. A good confirmation is the bullish Mirabozu – a candle with a long body and almost no shadows. Using the Hammer in Comprehensive Analysis Can Improve Trading Efficiency


