
Figure Wedge in technical analysis: how it looks on the chart, trading strategies in trading. Technical analysis of stock prices is a tool for visually determining the state and direction of the market. The basis of this tool is made up of various figures formed by the price movement. The article gives a detailed description of what a “wedge” figure is in technical analysis, what principles this model is built on, what information it provides. Additionally, the trading rules for this formation, the advantages and disadvantages of this figure, 3 main trading strategies are given.
- Figure “Wedge” – description and application
- Visual figure definition
- The constituent elements of the figure “Wedge”
- Types of the pattern – rising and falling wedge pattern
- Bullish wedge in an uptrend
- Bullish wedge in a downtrend
- Bearish wedge in an uptrend
- Bearish wedge in a downtrend
- The main differences between the wedge and other figures in technical analysis
- wedge and flag
- Pennant
- symmetrical triangle
- Ascending and descending triangle
- Practical application of the wedge pattern in trading
- Strategy 1
- Strategy 2
- Strategy 3
- Pros and cons
- Mistakes and risks
- Expert opinion
Figure “Wedge” – description and application
The wedge is one of the main patterns of technical analysis of stock prices. On the price chart, this pattern is formed after rapid price spikes that accommodate large volumes. After working out such a jump, the market goes into a slowdown stage, followed by a set of price volume. It is at this stage that the wedge is formed.

Visual figure definition
Finding a wedge formation on a price chart is not difficult. It is enough to know under what conditions a figure is formed. The wedge appears on the chart at the end of sharp price jumps, consists of an odd number of extreme points, has a clear narrowing from the base in the direction of movement. If you draw a line along the highs and lows of the price, then a graphical corridor will be formed, which narrows at an angle from the first high and low to subsequent extremes.
The constituent elements of the figure “Wedge”
A wedge consists of several price highs and lows. A distinctive feature of the figure is an odd number of formed waves. The figure is formed from several resistance highs and support points, which update their price position with each subsequent touch.

- The sharp drop in prices was slowed down by the full or partial “cancellation” of the available volume, with the formation of a new price low under pressure from buyers. Sellers do not have enough volume to continue the downward movement.
- After a price jump, buyers win back part of the price, pushing it up and running into resistance from sellers. A new price high is being formed. Typically, a new high and low form the first wave of a wedge.
- Selling pressure pushes the price down. But the lack of volume and the presence of buyers does not allow to gain a foothold at the level of the previous minimum or break it. A new low price is formed, which is above the first low.
- Buyers form the second wave, pushing the price up and not updating the previous high. Thus, the second wave of the wedge is formed.
The formation of new waves continues until the full set of the required volume for the continuation of the trend or its change. It all depends on the strength of market participants. Most often, the end of the rising wedge is accompanied by a breakout of the support line and the return of the price to the first low, with its further breakdown.
Types of the pattern – rising and falling wedge pattern
In technical analysis , there are 2 main types of wedge formation:
- Rising figure . The rising wedge is formed from new highs and lows that are much higher than the previous ones. This type of pattern has an upward trend in price.
- Falling wedge . Consists of lows and highs that are lower than the previous ones. The wedge is directed to the downside of the price.

Of great importance in the formation of these figures is the current trend present in the market.
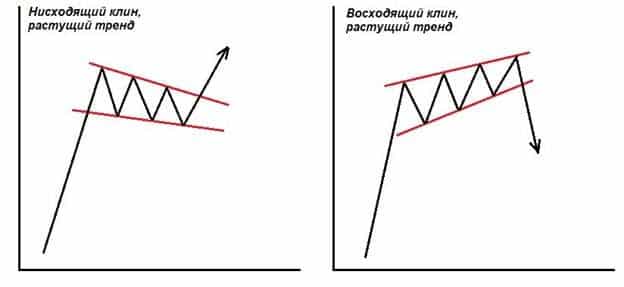
Bullish wedge in an uptrend
In an uptrend, such a figure is formed at the end of the price growth and indicates a break in the current trend. The logic behind the formation of a bullish wedge pattern in an uptrend is as follows:
- A new high was formed due to a sharp upward price movement. The buyers used all the available volume to make a new high or approach an important bullish level. Stopping the price also indicates the presence of the volume of sellers at this level and pressure from their side.
- Sellers put pressure on the value of the asset, forming a minimum, due to price correction. A new correction low is being formed.
- The next wave of upward movement indicates that buyers are trying to gain a foothold in new price lows, but do not have enough volume to move further and form a new bullish price level.
- New highs are also price levels for the beginning of a break in a downtrend. Sellers are trying to fix the price, for a more profitable start of the sale.

Bullish wedge in a downtrend
In a downtrend, a bullish wedge forms after an important price level is reached or broken. The logic of the shape formation is as follows:
- When a level is broken or reached, sellers spend all the available volume, not having a resource for further movement. At this level, they encounter buyers.
- Buyers win back part of the movement, creating a price correction with a new level. This is how the first wave of the bullish wedge is formed.
- Subsequent highs are formed due to the activity of buyers, but on low volume. It is not enough to break the trend.
- Subsequent lows are formed by sellers to secure a price position. Sellers allow you to create a number of points for the most profitable entry into the market.

Bearish wedge in an uptrend
The bearish wedge has a clear downward direction. Each subsequent minimum is lower than the previous one. The logic behind the formation of a figure in an uptrend is as follows:
- The price reaches or breaks an important price high with a full flow of volume.
- Sellers create a certain corrective rebound in the opposite direction, with small volumes, which are not enough to break the trend.
- Each ascending point of the wedge is formed by buyer pressure, but with a lack of volume, the previous levels are not broken through.
- Each subsequent low is formed by sellers who have the necessary volume to break through the previously formed lows.

Bearish wedge in a downtrend
In a downtrend, price breaks or hits an important low before the wedge forms.
- The price low is broken or reached using the full volume potential of sellers. The price of an asset stumbles upon the interest and pressure of buyers.
- Further, a correction is formed on the part of buyers, with a stop at a new correctional maximum.
- Subsequent lows are formed by sellers with insufficient volume. Each low is lower than the previous one.
- Buying pressure allows new highs to be made, but insufficient volume pushes them lower than previous ones.

The main differences between the wedge and other figures in technical analysis
Technical analysis includes not only wedges. There are a number of figures, the logic of formation and geometry of which makes them similar to the described pattern.
wedge and flag
https://articles.opexflow.com/analysis-methods-and-tools/pattern-flag.htm The flag pattern is a trend continuation pattern. Visually, the figure differs from the wedge in that its highs and lows form an equidistant channel. The pattern also has an angle of inclination, which depends on the activity of market participants.

Pennant
Looks a lot like a wedge. It also narrows in the direction of price movement. The main difference is that the pennant is a trend continuation pattern, consists of fewer waves and does not have an angle of inclination.
symmetrical triangle
https://articles.opexflow.com/analysis-methods-and-tools/treugolnik-v-texnicheskom-analize.htm This figure has a strong resemblance to a wedge. It differs only in the logic of education. The triangle has fewer waves, is formed near important price levels, as a volume accumulation pattern for their subsequent breakdown.

Ascending and descending triangle
Similar to a wedge in the presence of directionality. They differ in that they are directed in the direction of the trend and have a flat line of support, with a downward direction and resistance, with an ascent. The formation logic is also different. A flat level of support or resistance indicates the strength of market participants and their ability to stop the price without updating the highs and lows.

Practical application of the wedge pattern in trading
In practice, the trader has 3 main strategies for using the wedge pattern. Strategies allow you to find the most effective and safe entry points to the market.
Strategy 1
The meaning of this strategy is to find a point to enter the market on a change in trend. The following is a description of the strategy on the break of an uptrend, with the formation of a bullish wedge.
- The price has reached a significant uptrend level.
- A price range was formed from a high and a low (1 wave).
- When re-updating the maximum, the trader needs to set a resistance line at the formed points.
- When the lows are updated, a support line is drawn. This creates confirmation of the wedge formation.
- Next, you need to wait for a new touch of the resistance line and make a deal to sell.
- After the conclusion of the transaction, set a stop loss behind the resistance level, at a distance of at least 10 points, in compliance with the rules of risk management.
- Take profit is set at the level of the first low or beyond it.

Strategy 2
This strategy involves some risk, but it allows you to find the best entry point to break the trend and trade within the pattern itself.
- The trader must wait for the full formation of 2 waves (2 highs – 2 lows).
- Draw support and resistance lines on the chart.
- After a new high is formed, enter the market to sell.
- Set a stop loss beyond the level, at a distance of at least 10 points.
- Upon reaching the support level and rebounding from it, close the deal and open a new one in the opposite direction (buy).
- Set stop loss at a distance of 10 or more points, beyond the support level.
- Profit is fixed at the resistance level with a new entry, for a fall.

Strategy 3
The safest strategy, subject to the rules for setting protective orders.
- When forming a wedge figure, the trader clearly sets the support and resistance levels.
- Next, you need to wait for the breakdown of the support line.
- A sell trade is opened strictly after the breakdown candle is completely closed and a new candle is formed.
- After opening a position, you need to set a stop loss 10 points above the previous low.
- Take profit is set at the level of the first low or at the rate of the highest part of the wedge.

Pros and cons
The main advantages of the wedge pattern are:
- A clear definition of highs and lows on the chart in the correction condition.
- The greatest predictability of price movements.
- A visual hint about the direction of price movement towards the breaking of the current trend.
The main disadvantage is the similarity of the wedge with other patterns of technical analysis. The trader will need experience in identifying and trading this pattern.
Another disadvantage is a more accurate movement processing only on large time frames from H1 and above. At low time intervals, this formation is less accurate and forms much faster. Wedge pattern – technical analysis, rising wedge and falling wedge: https://youtu.be/qwXbkLIwYac
Mistakes and risks
When trading using the wedge pattern, traders make a number of mistakes. They are the following:
- Wrong interpretation of signals on the chart . Traders with insufficient experience enter a trade in the direction of the wedge and end up breaking the position when the trend changes.
- Incorrect stop loss setting . The most common mistake. The price can break through the set price levels with a short impulse, knocking out the trade with a small loss. This is done in order to reduce the volume of sellers or buyers (depending on the direction of the trend).
- Excess trading volume . Failure to comply with the conditions of money management leads to losses when the price rolls back to the next wave. You can increase the volume of the transaction only with the exact confirmation of the breakdown.
The main risk of trading in a wedge lies in the fact that the trader is fully confident in a trend reversal. But on which wave this will happen, the trader cannot be 100% sure. This can be helped, for example, by additional volume indicators. https://articles.opexflow.com/analysis-methods-and-tools/osnovy-i-methody-texnicheskogo-trajdinga.htm
Expert opinion
Many practicing traders use the wedge pattern in their technical analysis and trading. It helps to most accurately determine the further price movement and find the best entry point. This formation has a number of disadvantages, but all of them are easily overcome with an increase in trading experience. With insufficient experience, it is enough for a trader to wait until the figure is completely formed and start trading in a directional price movement. In this way, a number of risks can be reduced. The wedge pattern is a useful element of technical analysis. It helps to determine the presence of a market correction, the general trend of pressure from bidders, and highlight the most significant price zones. With enough experience, a trader gets a tool to find the most suitable and safe point to open a trade and take profit from the fastest part of a new trend.


