
To trade different asset classes, traders always need indicators that identify buy or sell signals. Especially when trading on short timeframes, monitoring the news and the economic situation is not enough, you need various forex indicators (stochastics among them), which will show on the chart how and when you need to trade. This article will focus on the Stochastic Oscillator indicator – its application and what it can be used for.
Stochastic indicator: description and application
The stochastic oscillator, often known as the stochastic indicator, was developed in the 1950s by George Lane as an indicator for his
countertrend system.. Contrary to what the name implies, the concept behind it has nothing to do with stochastics, which is used in statistics to refer to random processes. Rather, this oscillator is based on the observation that during an uptrend, the closing price of the asset under study tends to fluctuate at the top of the trading range. In a downtrend, the opposite is true, and the value tends to move towards the bottom of the range. However, in practice, the stochastic divergence indicator turned out to be not very effective as a pure indicator of trend changes, because stochasticity alone, especially today, is no longer enough to determine trend reversals or price changes. Rather, the stochastic oscillator indicator was able to establish itself as part of the analysis method,
Stochastic is used in a simplified form to calculate the range between highs and lows over a given period. Thus, the trader, when working with the indicator, needs to set a certain time interval.
Stochastic Indicator: how to use it and who will benefit from it?
Success in trading depends on a money and risk management strategy, as well as identifying entry and exit points. Stochastic is a very flexible and versatile indicator that allows you to determine the presence or absence of a positive investment scenario in a few seconds. Unlike many other indicators, the stochastic indicator is not designed to follow the trend, but to identify reversal points. Therefore, if the values indicate that a correction or rebound may occur in the near future, it makes sense to use a stochastic indicator to assess if a reversal is likely to occur in the near future.
Stochastic indicator for Forex trading
It doesn’t matter what asset class you plan to trade. Whether you are into crypto trading, trading classic assets like stocks, or active in the Forex market, it doesn’t matter. However, your strategy must be tailored to the relevant market and you must be well versed in the behavior of that market. First of all, active investors and traders benefit from the use of a stochastic indicator, for whom it is important that the technical analysis of price changes takes place as quickly as possible. However, while the stochastic indicator is suitable for all asset classes, it is especially popular with stock traders. If you want to learn intraday trading, the stochastic indicator has many tools to offer you. First of all, since stocks are very volatile,
Setting up the Stochastic Oscillator
Of course, if you want to use a stochastic indicator, you first need to set it up accordingly. The indicator is implemented on most major information and trading platforms, such as MetaTrader 4, where there is a default setting for the stochastic indicator. To use it, you only need to set the time span, as well as the corresponding maximum value, i.e. “H”, and the lowest value, i.e. “L”. To install Stochastic in the chart window, you need to open the “List of indicators” tab on the toolbar. Then select the “Oscillators” category, and in it – “Stochastic Oscillator”. Installing in a terminal window:

Calculation of indicators
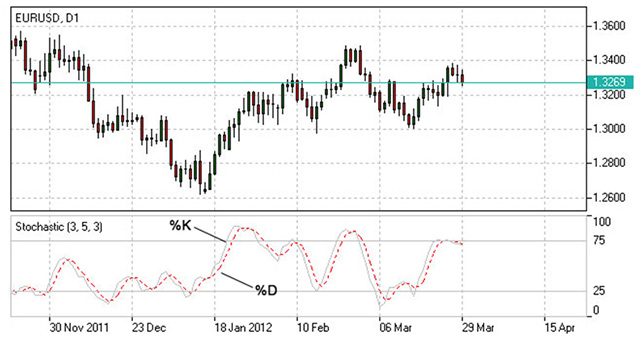
By default, the %K line is calculated over a period of 5 days, and the %D line is calculated over 3 days. “Slow stochastic” or “slow stochastic” has an identical wording and interpretation, but somewhat reduced sensitivity. “Slow” and “Fast” are often confused, especially because the middle lines used always have the same designation. However, when mentioning the Stochastic indicator, it is usually the “slow” version that is meant. Stochastic in QUIK terminal:

What does the Stochastic indicator show?
As a result, you get the “%K” indicator, which ranges from 0 to 100. A value of 100 indicates that the underlying asset under study is trading at the maximum of the time period under consideration. A value of 0, on the other hand, indicates that it is trading at a low. Then, to smooth out the rate and turn the fast stochastic into a slow one, an arithmetic moving average is calculated for the result, which is also denoted as “%K”. Finally, a signal line is added, which, in turn, is the result of a moving average of “%K” and is denoted as “%D”. For both moving averages, values of 3 or 5 are usually used as periods.
They are calculated using the following formula:
%K = (close price – low price) / (high price – low price);
%D = %K averaged over three periods.
Usage strategies
The position of the indicator on the scale indicates whether the analyzed underlying asset is in a state of overbought or oversold on the market. Values above 80 are considered overbought and, accordingly, the underlying value is subject to price decline. Values below 20 are considered oversold and therefore the underlying asset is vulnerable to a price retracement. However, if there is a strong trend, the underlying asset may remain in one of the mentioned extreme ranges for a long time.


Stochastic alert indicator
For many traders, such a system includes the automation of indicators. Some software applications and platforms offer an automatic alarm that issues a special message for certain scenarios and alarms. Upon receiving such an alert, you can either start trading immediately or recheck the trade against other indicators.
An interesting point: in addition, many trading platforms have the ability to implement automated trading. In this case, all you need is to set up the indicator and install the implementation of the corresponding actions for certain scenarios.
MT4 Stochastic Strategy Alert Indicator: https://youtu.be/7unY7xDm25k Since online investment through trading has a large number of variables, it is desirable to cover as many of them as possible with different indicators. In addition to the stochastic indicator, which can be used to detect a trend reversal, other indicators should be used that can either calculate highs and lows or determine a range. Therefore, in combination with the stochastic,
Bollinger Bands and other well-known instruments are often used.


Good breakdown on stochastic oscillator setup and strategy – the indicator itself is solid, but I’ve learned the hard way that mean reversion signals alone don’t cut it in prop firm challenges where drawdown rules are unforgiving. I started using Ratio X Toolbox after passing my second challenge, specifically their Stochastic Scalper EA for ranging markets, but paired it with MLAI 2.0 when the regime shifts to trending – the stress testing on that one respects daily loss limits which has kept me compliant. The real edge isn’t the indicator, it’s knowing which tool to deploy in each market condition. Are you scaling your stochastic signals or running them raw?