
Secrets of price action trading – what it is and how to use the Price Action system in trading, examples and tips. Price action is a trading method that allows a trader to read what is happening in the market and make subjective trading decisions based on recent price movements, rather than relying solely on technical indicators. https://articles.opexflow.com/analysis-methods-and-tools/osnovy-i-methody-texnicheskogo-trajdinga.htm Like any trading strategy, profitability depends on how the price action is used. Traders who practice the method focus on historical and current patterns to capitalize on where price might move next.
- Price action system – what is it, the basis for novice traders
- Understanding the market with price action
- Candlestick analysis is the basis of Price Action
- Price action patterns
- Why does the price action work?
- How to Trade Price Action – Understanding and Strategies
- Scalping and price action
- Structural merger factors and price action
- Working strategy price action
- How to use price action in practice
- Trading on a breakout of a chart pattern
- Horizontal breakout/retest trading
- Trading on a Breakout of a Trendline
- Pullback trading
- Entering a trade with a trend
- Price Action Trading: Factors to Consider
Price action system – what is it, the basis for novice traders
As the name implies, in this strategy the most important element is the price of a certain financial instrument. Price action is based on the observation and interpretation of price movement. Often analyzed in relation to price changes that have occurred in the past. The main thing that distinguishes price action trading from other strategies is that the technique uses “clean” or “naked” charts without indicators, with the explanation that the indicators themselves are interpretations of historical price movements (which do not contain any predictive power, and would not be available from the graphs themselves). However, this does not mean that price action traders do not use technical tools. Given that price action trading refers to recent and past price movements, all technical analysis tools (trendlines, Fibonacci retracements,
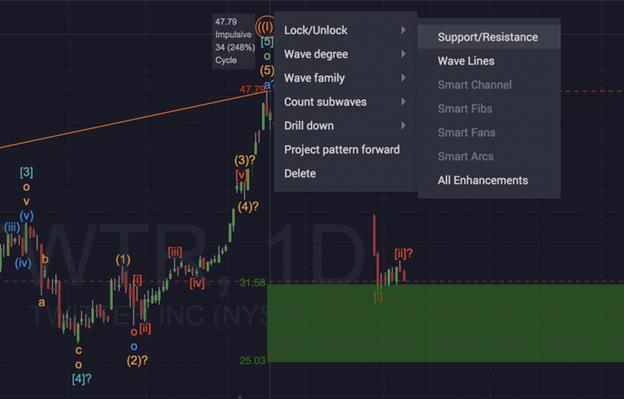
support and resistance lines , etc.) are useful for analyzing price behavior in accordance with the strategy that best suits the trader. https://articles.opexflow.com/analysis-methods-and-tools/fibonacci-channel.htm Price change data is usually presented in the form of
Japanese candlesticks or easy-to-read histograms. From the charts you get everything that the market has done for a certain period of time. All economic data and global news that somehow affect the price will be reflected in the price chart.
Understanding the market with price action
The main thing that a price action strategy trader needs to understand in order to make informed trading decisions is the current market structure. The first step in this definition is to find and mark key technical levels on the price chart. These are key support and resistance levels, which usually contain a large number of buy and sell orders, and therefore can be described as areas of increased demand or supply. Determining key support and resistance levels is best done on longer timeframes (daily or weekly). Find obvious swing highs and lows that have been repeatedly noted in the past and mark them with horizontal lines. These levels are the key support and resistance levels where the price is likely to pull back.

- Psychological support and resistance levels usually form around round number exchange rates (1.00, 1.10, 1.20, etc.). Many market participants place buy and sell orders around round numbers, so price can either match these levels or break them with unusually high trading momentum.
- Fibonacci retracement levels are used to look for potential levels where the price can recover and continue the main trend. When applied on higher timeframes, important Fibonacci levels like the 61.8% retracement level can become key technical levels where a lot of pending orders are placed.
- Pivot points can also be important technical levels where price may encounter support or resistance. Many traders follow daily pivot points and their support and resistance levels in their trading.
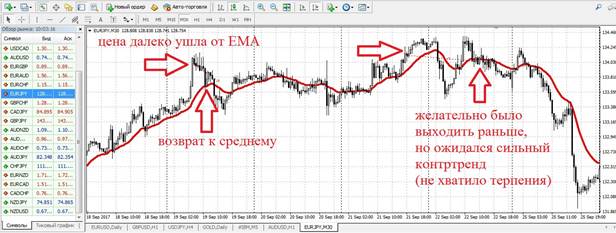
- Dynamic support and resistance levels . Key technical levels need not be static. Moving averages are commonly used to identify dynamic key technical levels that occur around the 50-day EMA, 100-day EMA, 200-day EMA, or around Fibonacci EMA levels like the 144-day EMA.
- Confluence factors are areas where technical levels intersect, further highlighting their importance.


Having defined the key technical levels on the chart, it’s time to analyze the current direction of the market – the current trend. Many price action traders only trade in the direction of the overall trend, as these trade setups tend to have the highest probability of success. Markets can move in three ways – up, down and sideways. A market that is moving up is in an uptrend. It is characterized by higher highs and higher lows on the chart. Higher lows are formed during price retracements, which are short-term price movements in the opposite direction of an established trend. They are usually formed as a result of profit taking by traders who are already in an uptrend. As soon as the price falls, new buyers enter the market, because they consider the current market price to be relatively low. This forms a higher low. Markets that make lower lows and lower highs are in a downtrend. Finally, markets that do not show the characteristic HH and HL uptrends and LL and LH downtrends, but move sideways with no obvious direction, are called ranging markets. In range markets, price action traders typically buy when price hits the lower end of the range and sell when price hits the upper end of the range. which do not show the characteristic HH and HL uptrends and LL and LH downtrends, but move sideways with no obvious direction, are called ranging markets. In range markets, price action traders typically buy when price hits the lower end of the range and sell when price hits the upper end of the range. which do not show the characteristic HH and HL uptrends and LL and LH downtrends, but move sideways with no obvious direction, are called ranging markets. In range markets, price action traders typically buy when price hits the lower end of the range and sell when price hits the upper end of the range.
Having marked the key technical levels on the chart, and having determined the general direction of the market, one key component is missing in order to get a more complete picture of the market and understand the current structure of the market. This ingredient is the psychology of market participants, as evidenced by chart and candlestick patterns.
Price action patterns show in real time the balance between the offer to sell and the demand for a given financial instrument. Any change in price implies a change in the balance between buyers and sellers – an increase in supply will lower the price, while an increase in demand will push the price up. The price action trader bases his trades on the assumption that if buyers’ demand exceeds sellers’ supply, the price will necessarily rise higher or vice versa.
Candlestick analysis is the basis of Price Action
Whatever the timeline, each period corresponds to a candlestick or a bar. Candles summarize price action over a set time period, so on a 5 minute chart each candle represents 5 minutes of price action, while on a daily chart only one candle per day is created.

Candlesticks are the main visual identification of a price action chart. Understanding them is critical for a trader to open or close positions at the right time.
The candle contains four price levels – opening (Open), closing (Close), minimum (Low), maximum (High). The body of the candle indicates the range between the opening price of the period and the closing price. On a bullish candlestick (indicative of an increase in price over the time under consideration), the opening is indicated by the lower part of the body, and the closing is indicated by the upper part. And, vice versa, for a bearish candle (indicating a price drop). Wicks (shadows or tails) show the range of price movement during the period. Whenever prices reach levels outside the range bound by the open and close levels, shadows are seen with their extent (highs or lows). Color schemes are used to determine the price movement represented by a candlestick. Bullish candles are usually white, blue or green, while bearish candles are black or red.
- Long bodies of candlesticks show strong momentum and decisive market behavior in an open-to-close move, however, show increased volatility as some prices are reached over a period of time but are eventually excluded from the open-to-close range.
- Small bodies can indicate market indecision or a balance between bullish and bearish forces.
A common way to describe price behavior over time is a trend. This is the main direction of price movement in the corresponding time window.

- An intermediate trend line is a diagonal line from which the market bounces twice. This trend line indicates a potential but not yet confirmed trend.
- Confirmed trendline – The market has bounced off this trendline three times. Traditional analysis takes this as a sign that the trend line is real and that the market will react around it.


Support and resistance lines are usually horizontal, but when they are diagonal along a trend, they are called trend lines.
The theory of using these lines is that the market has a kind of memory – the price behaves in a certain way in relation to certain levels, which used to be important turning points. When the levels are below the current price, they constitute “support”, a potential buffer against a bearish move. When the levels are above the current price, they appear as “resistance”, a potential barrier to a bullish move. Once the price approaches these levels, traders often expect these levels to be tested, broken, or protected before gaining confidence in the price direction to enter a trade. When the price passes through one of these levels, they play the opposite role. When an uptrend is broken, “resistance” becomes “support”, indicating a significant level,

The most conservative or reliable trades are those that occur when the market fluctuates between identifiable support and resistance levels. This allows you to buy in an uptrend when a bearish leg pullback has brought prices down to a support level, and then sell when the price returns to a resistance level, or, in a downtrend, sell when the price has topped out at a reliable resistance level.
Price action patterns
A candlestick pattern is a single or sometimes multiple bar price action graphically displayed on a candlestick chart that price action traders use to predict market movement. Patterns are often the most timely indicator of the balance between buying and selling demand. However, pattern recognition is somewhat subjective and requires training as well as personal experience to develop the skills to identify and trade candle patterns. There are a variety of patterns, many of which are just slight variations on the same basic principle. Therefore, it makes sense to focus on a small “group” of patterns that give the trader a reliable set of signals to work with.
Same High Lower Close Bars (DBHLC) and Same Low Higher Close Bars (DBLHC) – the name might sound complicated, but the pattern is easy enough to understand. The model is based on the concept of support and resistance.


DBLHC is the inverse of the DBHLC template. Both candles have the same lows, and the close of the second candle is higher than the high of the first candle.

An example of a bearish setup

Example of a bullish setup
Two bars with the same high (TBH) and two bars with the same low (TBL) are bi-directional pricing patterns that work in both directions regardless of the direction of the trend. All trading with such patterns is identical to trading with an inside bar. The reason is that the last bar is the inside bar for the previous bar. Almost all the patterns of the Price Action strategy are two-sided, which allows you to both buy and sell. TBH – bar highs at the same level. If the price exceeds the high of the second candle, then this is a sign of a continuation of the trend, the low is a trend reversal. Example of a transaction using TBH:

railsis a simple reversal pattern that usually forms at the end of trends or large swings.


A reversal to close price
(CPR) is a well-known and frequently traded candlestick pattern.


Pin bar , also known as the Pinocchio bar, is the most common price action model. Represents a candle with a small body and a long shadow on one side.

pin bar with a long lower shadow . The trade should be opened with a pending buy stop order above the top of the pin bar, and with a stop loss at the bottom point.

Inner bar (
inside
bar
)is a popular reversal/continuation candlestick formation that requires at least two candlesticks. This pattern is a direct play on short-term market sentiment trying to get in before the “big moves” that may occur in the market. The inside bar shows the reluctance of prices to rise above/below the previous high and low of the candlestick, indicating market indecision.

For a bullish inside bar pattern

Bearish option
The shadows of the inside bar can go beyond the first candle, but ideally, when both the body and the shadow of the candle are inside the first bar, such signals are more reliable. Also, inside the first bar there can be not one, but several candles, the main thing is that they comply with all the rules of the price action trading system. In this case, the pattern is assigned a number based on the number of inside bars, such as IB2, IB3, and so on.

An outside bar is a two candlestick pattern in which the second candle has a higher high and a lower low. The range of the second candle must exceed the range of the first. This means the price range and volatility are expanding, showing strength in both directions. In most cases, it is not clear whether the bulls or bears have won, the only certainty is increased volatility.

BUOVB (bullish outside vertical bar)

BEOVB (bullish outside vertical bar)

Why does the price action work?
Many charts today are full of indicators that are difficult to understand. However, all they can offer is price reading, bare and raw, represented by candles. You only need candles, as well as simple support and resistance lines. By trading price action on clean charts, you eliminate distractions and focus on the most important element, price. This is actually the only element required for success in the markets. Many traders believe that the market follows random patterns and it is not systematically clear how to identify a strategy that always works. Because price action combines technical analysis tools with recent price history to identify trading opportunities based on the individual trader’s subjective interpretation, price action trading is highly supported in trading.
How to Trade Price Action – Understanding and Strategies
First of all, you need to know the different types of charts and the signals that can be read from them. Next, you need to develop the skill of identifying pricing models. It also means learning how to draw support and resistance lines. Over time, an intuitive understanding of how prices behave when they reach certain trend points will come. The only workspace a price action trader needs is a clean chart without any technical indicators (with the exception of moving averages in some cases). A clean price chart helps the trader to focus on the price movement and not on lagging technical indicators.
The main goal is to catch a trend at an early stage and follow it until it becomes invalid. It is important to note that price action traders try to combine a number of tools in their analysis, which increases the likelihood of successful trades.
In fact, in the price action trading system, it all comes down to learning how to trade setups or price action patterns from merging levels. Due to the nature of market operators, their reactions to global economic variables, price action tends to repeat itself in different patterns. Price action charts reflect changes or continuation of market sentiment. Thus, having learned to identify price patterns, you can get “hints” about where the price will go next. Generally, they can be divided into two categories:
continuation patternsand trend reversal patterns. https://articles.opexflow.com/analysis-methods-and-tools/figury-texnicheskogo-analiza-v-trajdinge.htm While continuation patterns signal that the main trend is about to continue, reversal patterns signal on the contrary, that the main trend is about to reverse. The main continuation patterns are
rectangles ,
flags , falling
wedges (during an uptrend) and rising wedges (during a downtrend). Basic Reversal Patterns –
Head and Shoulders, inverted head and shoulders, double top and double bottom, falling wedges (during a downtrend) and rising wedges (during an uptrend). Price action on cryptocurrency – understanding the market, trading strategies, how to use price action in this market – video instruction: https://youtu.be/BzaS4dgQvxE
Scalping and price action
Scalping involves entering and exiting a position quickly to take advantage of small price movements, regardless of what is considered a small price movement for that asset. Many scalpers usually use 1-minute charts. The scalping strategy aims to trade in the direction of the trend and enter during a pullback when the price starts to move back in the direction of the trend. To do this, traders look for engulfing patterns that signal an entry, such as when a candle in the trend direction covers a candle in the direction of a pullback. This happens during a rollback.

Structural merger factors and price action
In the context of price action trading, confluence is the point/level where two or more factors converge (or intersect) together to form a hot spot (confluence point) confirming the same trading signal. For example, the price moves to the resistance level, if you check the Fibonacci retracement, almost like a confluence that the resistance level is also at the 61.8 Fibonacci level. But that’s not all, the general trend is also downward. So there are three factors that line up:
- general downward trend;
- the resistance level that the price is approaching;
- the price is also heading up to the 61.8 Fibonacci level, which coincides with the resistance level.

Working strategy price action
More experienced traders retain a variety of options for recognizing patterns, entry and exit levels, stop losses and obtaining relevant information. Using only one strategy may not provide sufficient trading opportunities. Price action trading strategies that can guarantee good results if used correctly:
- Breakout (breakout) – the technique combines the presence of a wide-range candle (the highest of the last 9 sessions) and a new high of 2 months. This makes the installation more “reliable” and fun to work with.
- The pin bar can be used in any market context, whether to look for a resumption of a trend after a pullback or to identify reversals from important highs or lows. It goes well with false breakouts of key levels.
- Inside bars are ideal for tracking current trends, especially when there are two, three or more of them in a row (their explosive potential is huge).
How to use price action in practice
Trading on a breakout of a chart pattern
Entry into price action trades is usually based on some sort of confirmation that triggers the setups. Basically, these are breakouts of technical levels, which are confirmed by candlestick patterns.

- 1 – left shoulder.
- 2 – the head of the pattern.
- 3 – right shoulder.
- 4 – neck line connecting the lower parts of both shoulders.
The Head and Shoulders pattern is an important reversal pattern that forms at the high of an uptrend. The trader waits for the opening of a short position until the price breaks the neck line. Once a breakout occurs, the profit target for the trade is the pattern height (5) projected from the breakout point (6). Stop losses are usually placed above the neck line (aggressive approach) or above the right shoulder (traditional approach).
Horizontal breakout/retest trading
Some traders prefer to take trades based on breakouts from horizontal ranges. This approach would require a ranking market with clear upper and lower bounds.

Trading on a Breakout of a Trendline
Markets tend to break up or down trendlines in trending market conditions. Traders use trendlines to connect higher highs during uptrends and lower lows during downtrends, the breakout of which creates an opportunity to trade in the direction of the breakout. A broken uptrend line essentially means that the price is likely to make a new lower low, which is a characteristic of a downtrend and signals a potential trend reversal. Similarly, a broken downtrendline means that price is likely to make a new higher high, a characteristic of an uptrend.
Pullback trading
Pullback traders try to buy a stock or commodity when the price has temporarily fallen in the face of a broader uptrend. To trade, the market must move in a certain direction, up or down. Without a trend within a trade, it is impossible to profit on a rollback.
Entering a trade with a trend
The first step is to determine the underlying direction of the market – is the pair trending up or down? Uptrends are formed by higher highs and higher lows in price, while downtrends are formed by lower lows and lower highs. It is important to understand that on the way up, the price will sometimes move in the opposite direction of the trend. These price movements against the trend are called price corrections and form a characteristic zigzag pattern during an uptrend. To enter a trend following trade, traders use Fibonacci retracement levels to measure the distance of a retracement from the previous impulse wave.

Price Action Trading: Factors to Consider
Managing risk in price action trading is similar to managing risk in any other style of trading – the same rules apply. As for the real factors that traders should keep in mind:
- Current market structure . In an uptrend, buy opportunities; in a range, buy near range lows at support, or sell near highs at resistance, in a downtrend (sell opportunities).
- Areas of value on the chart . Enter support/resistance levels or levels that suggest pivot points in the market. For example, if the market is in an uptrend, it could be a support area, a low swing, a moving average with a period of 50 trend lines, from which the market has bounced several times.
- Putting a stop loss between those levels, or where there is no real sign of such strength, which will cause this change in direction in the market.
Essentially, traders try to enter at tipping points. The levels between turning points are “empty zones” where stops can be placed. For example, if you enter a trade at a support level expecting the price to rise, you can place a stop well below the support level you entered, provided that it was not also a support level. In this case, if the stop is hit, it indicates that the original thesis underlying the trade was not justified. The key to success in trading is having a conceptually sound, accurate, well-structured, and effortless method. Experience, both in managing trades and in the inevitable phases of long drawdowns, can make all the difference in order to always stay on the right course without deviating from it, but this does not detract from the fact that even novice traders or those


