What is a trend in trading, how to identify it on a chart, and how to trade an uptrend and a downtrend. The ability to recognize a trend in trading helps to successfully trade assets. Trend in a broad sense is the vector of asset price movement. The term was introduced by Charles Dow, the founder of the theory of
technical analysis . A trend, in simple words, is a method of tracking the dynamics of growth and fall in asset prices. Based on these points, you can also determine the end of the trend. Dow Theory is not the only and unambiguous price forecasting tool. From this point of view, three types of trend can be distinguished: uptrend, downtrend and sideways. A sideways trend is the absence of growth or decline. Another name for this phenomenon is “flat”.

- How to identify a trend?
- Types of trends in trading
- Stages of formation
- Trend Characteristics
- Dynamic levels
- How to enter and exit a trade in trend trading?
- How to gain positions and put stops in trend trading?
- The concept of counter-trend, information of traders against the trend
- How to identify and catch trends in trading?
- Trend trading mistakes
- Late entry
- Trading in a growing market
- How to understand the angle of movement along the trend?
How to identify a trend?
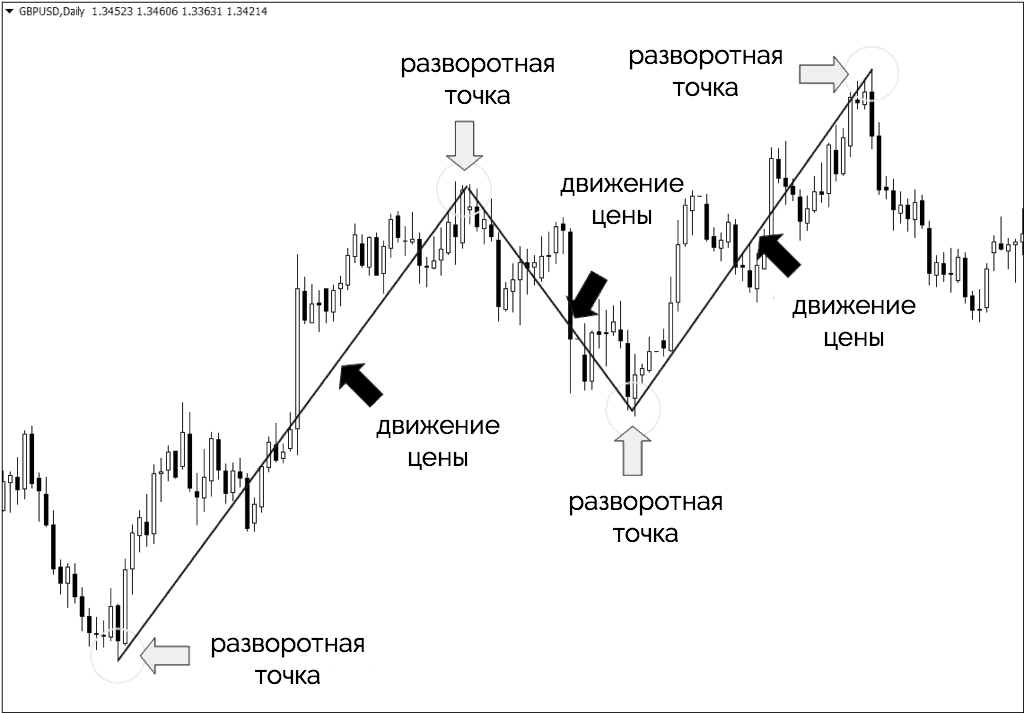
To answer this question, it is necessary to understand the role of this phenomenon in trading. Analysis of the price movement vector is the basis for making investment decisions. If the price is trending, then the trade is more likely to make a profit. In all financial markets, the price moves in the form of a zigzag. This zigzag helps build analysis and predict prices. For this purpose, various methods are used. They are the following:
- Graphical Analysis . The method is to build a price growth line. As long as the price is above or below this line, traders say that the price continues to trend.
- Technical Analysis . Indicators are used in technical analysis. Technical analysis helps to track not only the price vector, but also the strength of the trend. In this case, moving averages are used to achieve the goal.
- Fundamental Analysis . It involves the analysis of information, from technical to economic. With regard to cryptocurrency, this means studying information about a cryptocurrency project, ontology, related factors, project plans, and so on. This method is suitable for building a long-term forecast.
- Volume analysis . The volumes of growth and decline are compared. If the amount of growth is tangible, it is reasonable to believe that the vector is moving towards a peak and there will be a reversal soon. If the fall is dramatic, growth is expected.
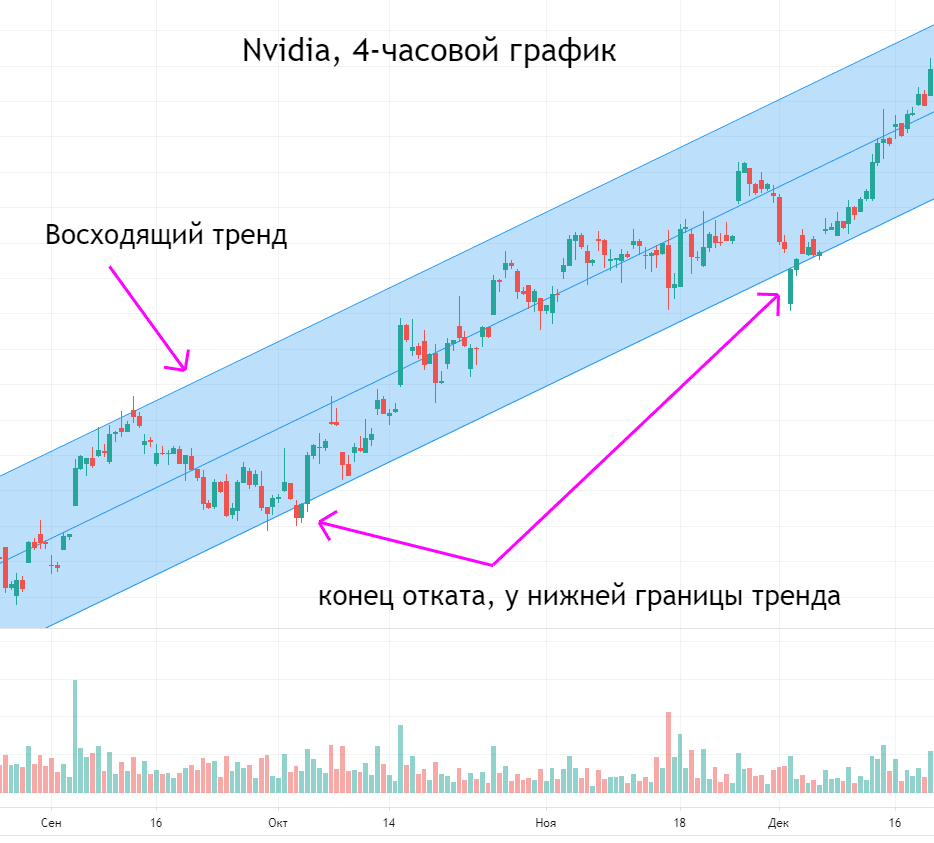
- Trend is your best friend: a trend is a trader’s best friend. The trade entry point must be in the uptrend.
- It is useful to use multiple entry points in the direction of the trend. At one point, use part of the funds, at the other – the other part. That is, do not pour all the funds at one point.
- Use stop orders to prevent losses. It is advisable to place a stop order behind the growth line and should be adjusted as prices change.
- Don’t forget to exit the trade on time. This may be upon reaching the planned level of profit. Or when adjusting the stop order, this happens automatically.
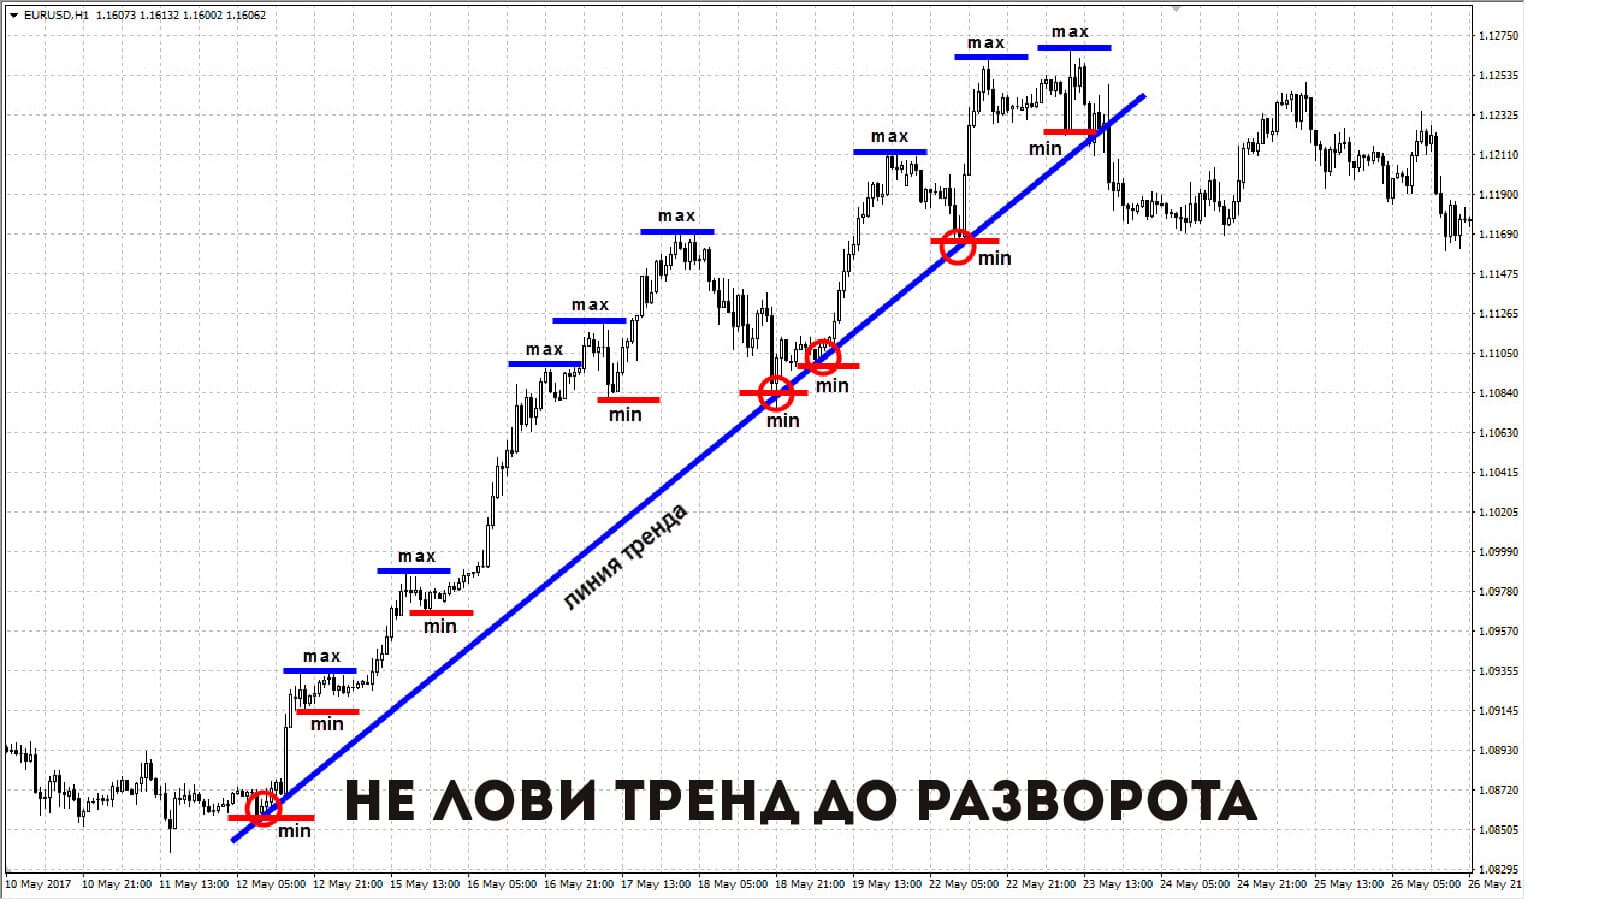
It is important to pay attention to the last point. Professionals warn that it is not the ability to stop on time that fails beginners. The trend tends to end suddenly, or change the vector of movement. Then the profit can turn into a loss.
Types of trends in trading
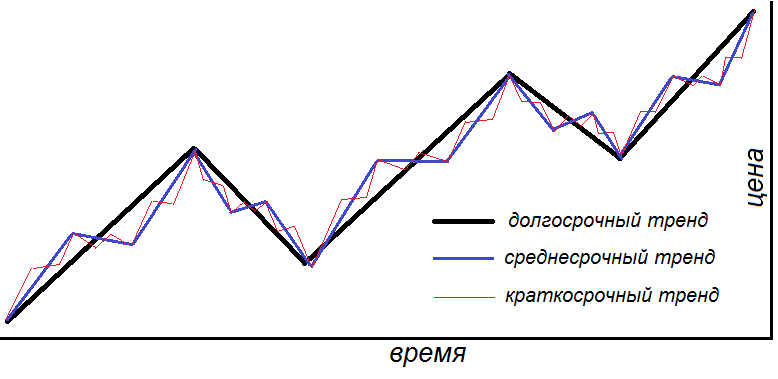
According to the theory, trends in all markets are divided into the following types:
- Global trends going back years . They show the general directions of movement.
- Intermediate trends are measured from several months to several years.
- Short-term trends show current market changes. This also includes speculative movements and insignificant trends.
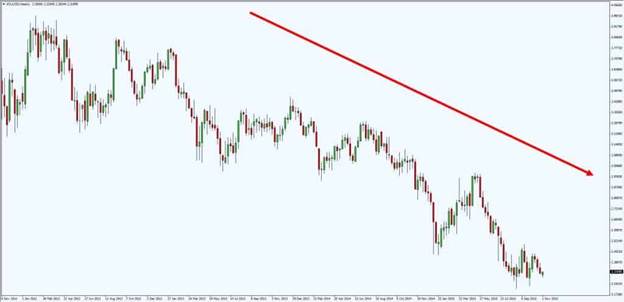
All three types of trends exist simultaneously in all markets. For traders, the minimum and maximum points matter. Uptrend:

Stages of formation
The formation of a trend occurs in three stages. Let’s consider each of them.
- accumulation phase. Usually precedes a recession phase. This moment is taken into account in the strategy of traders as a start to opening long positions. It is believed that the price has reached a point where the purchase of assets can be quite profitable. The accumulation phase tends to start the asset value growth.
- Mass character . The number of investors at this stage is increasing. The arrival of the “crowd” is expected. This process happens gradually. At this stage, the maximum growth in the value of assets is observed. In terms of time, this period is longer than the accumulation phase and the subsequent stage.
- Distribution stage . At this stage, growth rates are insignificant or stop. This is the point where most investors consider their profit target to be reached. They begin to sell assets to those who are still included in the trend. Sales volumes are offset by new purchase volumes. After that, the price curve goes into a flat or goes down.
We have considered an uptrend. A downtrend is when a given cycle passes below the classic line. Significant changes in the dynamics of the movement of assets and in the transition from one phase to another, large investors play an important role. One trader, even with a solid portfolio, is not able to influence the movement of the trend. The goal of the trader in this process is to recognize the stages in time to determine the optimal entry point. Toward the end of the stage, the probability of an incorrect entry increases. In this case, instead of profit, the trader may receive losses. How to trade trendlines: https://youtu.be/JLXt4SzGcwQ
Trend Characteristics
The trend has several properties. It can be summarized according to the following characteristics:
- Presence of direction : downtrend and uptrend.
- duration . There are three types: short-term, medium-term and long-term.
- Strength . Shows the number of traders involved. The more traders are included in the trend, the more influence they have on the direction and its vector. Also, the number of traders involved affects the balance of sellers and buyers of assets. Asset prices rise in direct proportion to the number of traders involved.
Also in the Dow theory, the main characteristics of the trend are highlighted. Within this theory, the following characteristics can be distinguished:
- a growing trend tends to continue along the vector, which will make a sharp reversal or end;
- the stronger the trend, the longer it lasts;
- growth or fall tends to end at any moment;
- if in the past, under certain conditions, the motion vector obeyed a certain pattern, this does not mean that once again this rule will work under the same conditions.
These characteristics can clearly be tracked by the dynamics in the cryptocurrency market.
Dynamic levels
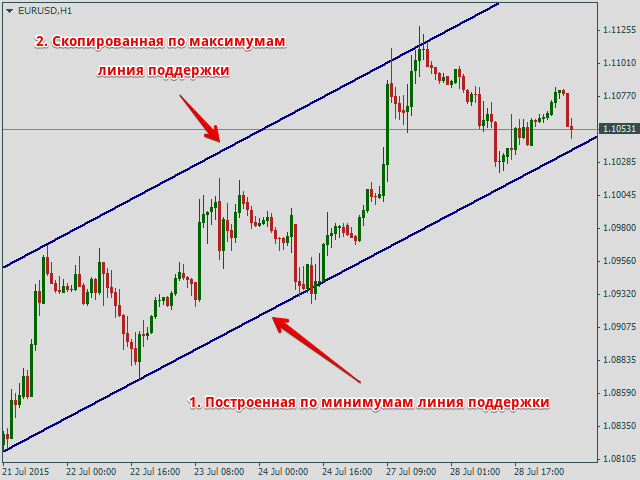
Dynamic levels are moving averages. There is a support level and a resistance level. If the trend curve is above the trend curve, then it is said to be resistance. If it is below the line, then this is a support zone. Trade entry points are in between these categories.
How to enter and exit a trade in trend trading?
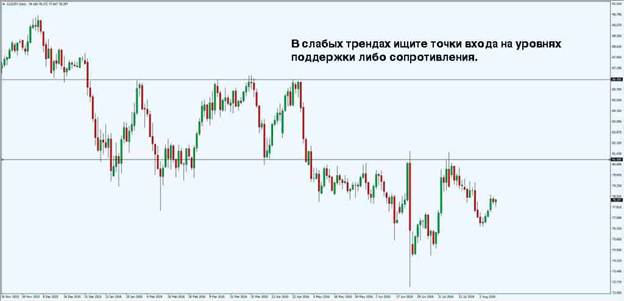
For traders, the law of levels applies here: if the curve is at the resistance level, you need to sell assets, if it is lower, then buy. Also, a successful entry into the transaction is considered the moment of crossing the moving averages. However, you should not rush. Experienced traders know the psychology of beginners, that with such pictures, they will immediately begin to open deals. You need to wait until a sufficient number of orders are opened. This is called confirmation.
How to gain positions and put stops in trend trading?
One of the simplest and most profitable strategies is price action trading. Price action is a method in which a trader focuses only on the chart, not paying attention to indicators. Trend analysis within the price action is carried out by the level of support, resistance and candlestick patterns. Also, as part of the price action, you can effectively manage your risks. Stop loss will help with this. Stop loss is a mark that is set in advance. This is necessary in order to insure the trader against large losses during a downtrend chart. There are different stop loss strategies. Professionals recommend placing stop losses behind certain barriers along the way of the trend. What are the barriers? For example, these:
- support and resistance levels;
- psychological marks;
- highs and lows of the latest candlestick patterns.
Placing a stop behind the barrier is justified by the fact that the price often tests the reached level. Breakouts occur in this process when the stop loss is hit by the price, then goes in the “correct” direction. When trend trading, setting stops is simple: it is recommended to place them in three places: behind the moving average line, behind the previous pullback line, and outside the dynamic trend lines.
The concept of counter-trend, information of traders against the trend
A counter-trend is a short-term price movement against the current direction. For a trader, this point is attractive because it makes it possible to enter the market with a moderate risk-to-profit ratio. However, finding the optimal point in a countertrend is not an easy task. There is a high probability of draining the deposit. Therefore, this strategy is suitable for experienced traders. In making decisions within the framework of the counter-trend, they are guided by the following parameters:
- determine the right direction of the current trend;
- identify likely price reversal points;
- find a reliable trading signal.
The countertrend is based on the simple logic of trend information. If all investors say that the price of this or that asset will grow, then many have already bought these assets and are waiting for growth. Since everyone has bought, then the trend is close to a reversal. If everyone claims that this or that instrument will fall, then most likely the majority have sold their assets and, most likely, the trend dynamics is close to a reversal in the direction of growth.

How to identify and catch trends in trading?
The surest way to find trend and trend is to use a moving average in your analysis. The optimal strategy is to determine the optimal timeframe and trade only within it. Charts of other timeframes should be applied after careful analysis.
Trend trading mistakes
Often, traders can ignore the advice regarding the upside entry point and the downside exit point. Another common mistake is to enter the resistance phase without confirming the price.
Late entry
When entering late, it is useful to adhere to the principle of “set a stop loss and forget it.” Otherwise, the trader should be prepared for the following:
- Wide stop loss range;
- The risk/reward ratio is reduced from 1:4 to 1:2;
- There is a chance to hit the peak of the trend.
These factors can be used to your advantage.
Trading in a growing market
Here the rules are:
- you can not open deals at the moment when the price breaks through the highs;
- entry can be made only after the price correction after the broken high;
- do not rely heavily on pending orders.
How to understand the angle of movement along the trend?
The angle of movement shows the proportions of supply and demand. If the angle is steep, then there are more sellers in such a market than buyers. If the angle is slightly flat, then this indicates a significant number of buyers who are ready to deal, but the process has not yet started. The ability to read slopes opens positions for finding profitable setups. To find a favorable entry point, it is useful to combine trend angles with price action signals. This term explains phenomena not only in trading, but also in fundamental sciences. A trend in the economy is a vector of movement of indicators. There is also a trend in statistics that helps to identify the direction of development of certain social phenomena. The ability to read these indicators and take note of helps to make the right decisions in other areas.
