
Momentum Indicator – description and application, Momentum trading strategy, how to use it, entry and exit signals. Momentum is one of the simplest and most popular indicators among traders. As its creator, some sources name the French mathematician Paul Emile Appel. This indicator helps to determine the direction of the trend and the rate of price change.

- What is the Momentum indicator and what is its meaning, calculation formula
- Types of the Momentum indicator, how it looks on the chart
- Building an indicator
- How to use Momentum, setup, trading strategies
- Setting the indicator
- Trading strategies
- The second strategy “Momentum as a trend reversal indicator”
- The third strategy “Divergence”
- What instruments should and should not be used with this indicator
- Pros and cons of application
- Application in different terminals
What is the Momentum indicator and what is its meaning, calculation formula
Momentum is an oscillator indicator that compares the closing price of the current time period with the closing price of the set interval. Momentum shows the speed and direction of price changes. The popularity of Momentum is mainly due to its simplicity, versatility and ability to give early signals from time to time. The indicator not only shows the direction of price movement, but also, by evaluating the rate of change of the quote, can show reversal points on the chart. Momentum helps to determine the acceleration or deceleration of the trend. When the indicator reaches a new high, it means that participants are optimistic about the market, and prices are likely to continue to rise. When the indicator falls to a low, this indicates an increase in market pessimism and a high probability of further price declines.
The formula for calculating the indicator is as follows:
Momentum = Close (i) – Close (in)
Where:
- Close (i) – last closing price
- Close (in) – closing price n periods ago
- n – pulse period
Later, the formula changed a little and the price difference was replaced by their coefficient, so now the formula looks like this:
Momentum = Close / Close(in) * 100
Types of the Momentum indicator, how it looks on the chart
Among traders, the following varieties of the Momentum indicator are most popular:
- Rate of Change (ROC), Rate of Change
Rate of change is a mathematical concept that shows how one value changes compared to another. Traders use this indicator to compare price changes with each other. 
- Relative Strength Index (RSI), Relative Strength Index
The Relative Strength Index was developed in the 1970s by Wells Wilder. A well-known technical analyst outlined his calculations for the indicator in his book New Concepts in Technical Trading Systems. 
- Moving Average Convergence-Divergence (MACD)
MACD is an indicator that fluctuates around zero. The calculation of the indicator follows the same logic as the calculation of a simple moving average. The indicator itself is equipped with additional functionality that provides a better idea of a more up-to-date moving average. When the MACD moves into the positive zone, traders begin to consider it as a “buy signal”, when the indicator goes into the negative zone, it is considered as a “sell signal”. Analysts who prefer to follow the trend usually use this indicator in addition to other technical analysis tools. 
- Chande Momentum Oscillator indicator (CMO).
The Chande Momentum Oscillator (CMO) is a technical modification of the Momentum indicator developed by Tushar Chande. The indicator is created by calculating the difference between the sum of all recent closes and the sum of all recent closes, and then dividing the result by the sum of all price movement over a given time period. The result is multiplied by 100 to give a range of -100 to +100. A certain period of time is usually 20 periods.

Building an indicator
Attention! The indicator is calculated in a separate window below the price chart. It is built very simply – all candlesticks (minimum and maximum extrema) are recorded and connected point by point in the form of a continuous line (sometimes ascending, sometimes descending).

How to use Momentum, setup, trading strategies
Momentum consists of one main line, which compares the current price position with the position of the previous period.
Setting the indicator
The following parameters must be configured for the indicator:
- Period (Period) is the period for calculating the main line. The default value is 14.
- Apply to – selection of the required price parameter, usually the closing price (Close).
- Style (Style) – setting the color style and line width, i.e. visual elements of the chart.
- Fix maximum and minimum – change the indicator window within predetermined boundaries.

Attention! The classic use of the indicator assumes that the value of the Period parameter is 14. However, traders can experiment and evaluate the performance of the indicator on other timeframes. Ultimately choose the one that suits you best.
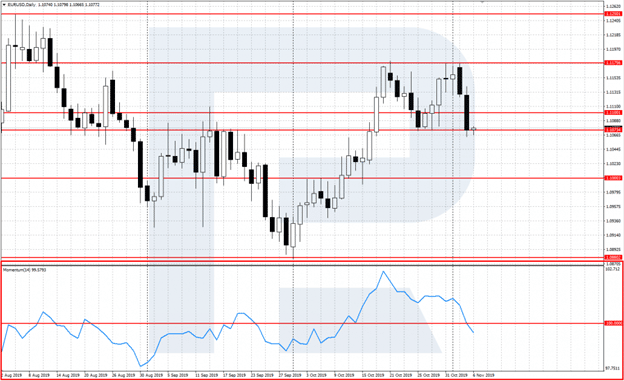
Level 100 is drawn in the Momentum window (shown as a red horizontal line in the figure). This is the center line of the indicator, towards which it moves. When the indicator is above this line, it indicates an uptrend, when it is below 100, vice versa.
Trading strategies
The main and most effective strategy involves using the red line showing the value of 100. This is the level indicating the trend: if the indicator is above 100, the trend is up; if it is below 100, the trend is down. A buy signal appears when the indicator crosses the center line from below. After the indicator consolidates above 100, we can open a buy position (Buy), the stop loss is placed behind the local minimum. Take profit will be activated when the price approaches the nearest strong resistance level.


The second strategy “Momentum as a trend reversal indicator”
The second strategy is based on using Momentum as a trend reversal indicator similar to RSI. It is necessary to buy when the indicator value reaches the bottom and turns up, and it is necessary to sell when the indicator reaches a maximum and turns down. Since there are no overbought/oversold zones like RSI to identify possible lows or highs, instead, a trader needs to test different overbought (OB) and oversold (OS) levels.
The third strategy “Divergence”
This method assumes that market tops are usually defined by fast price increases (when everyone expects prices to rise) and that market bottoms usually end up with fast price declines (when everyone wants to get out). When the market peaks, the Momentum chart rises sharply and then declines, deviating from the continued upward or sideways movement. Similarly, at the bottom of the market, the chart will drop sharply and then start to rise well ahead of prices. Both of these situations lead to discrepancies between the indicator and prices.

What instruments should and should not be used with this indicator
The indicator shows price fluctuations from the so-called “normal values” (in this case, from a value equal to 100), i.e. signals about the state of “overbought” or “oversold” prices. Indicators such as the Williams Range, Stochastic Oscillator, RSI (Relative Strength Index) and CCI (Commodity Channel Index) are more or less close to Momentum, so it is better not to use them in conjunction with the indicator. To filter out losing trades, traders can use moving averages in conjunction with the Momentum indicator. If the average on the higher timeframe rises, we only use the indicator signals to buy on the lower timeframe. Conversely, if the average on the higher timeframe is decreasing, we only use the indicator’s signals to sell on the lower timeframe.
Pros and cons of application
Among the advantages are:
- There is no direct relationship between the direction of price movement (up or down) and the strength of these movements.
- The Momentum indicator helps traders and analysts identify points where the market may turn around. The points are determined through the divergence between the price movement and the indicator.
- The ability to use the indicator with other trading signals and types of technical analysis that show price trends and directions.
Among the disadvantages:
- The indicator shows only the relative strength of price movements without taking into account the direction of price movements.
- Momentum does not provide much information other than what can be seen by simply looking at the price chart itself.
- A long wait for the signal of the momentum indicator crossing, which slows down the completion of a full-fledged transaction. And the signal appears shortly after a certain point.
Application in different terminals
It is best to use this indicator on the international trading platforms MetaTrader 4 and MetaTrader 5. Momentum is already pre-installed in the list of indicators and is in a separate section in the standard form. To do this, in the special menu “Insert” select the item “Indicators”, in the next section – the item “Oscillators”. The Navigator window will open on the left side of the terminal. A complete list of all indicators, trading signals and pre-recorded scripts will appear. In this list, you need to scroll to the middle and find Momentum there. Using the left mouse button, drag on the chart to the bottom. After that, a special window with indicator settings will open:


