On Balance Volume (OBV) indicator – description of the indicator, its essence, view on the chart.
What is the On Balance Volume indicator and what is the meaning, calculation formula
In order to conduct a transaction, it is necessary to find such a market situation that the chances of making a profit are maximum. To do this, use the techniques of fundamental and technical analysis. However, thoughtless application will not lead to success. A trader must understand what is behind this or that data obtained with the help of technical indicators, only in this case he will be able to use them with maximum efficiency.
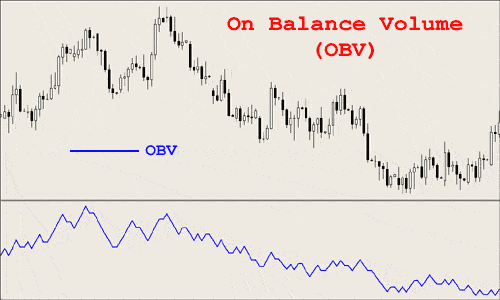
This indicator was first described by Joseph Granville in his book entitled A New Stock Market Strategy in 1963. The author substantiated the effectiveness of the indicator by the fact that the volume is actually the driving force behind changes in securities quotes.
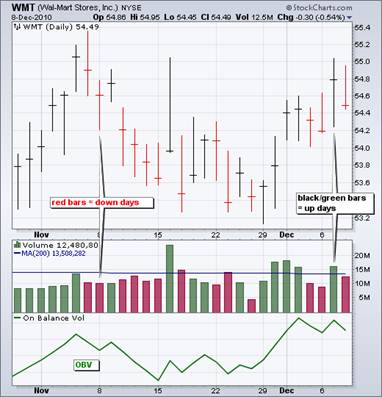
If the user uses the On Balance Volume Indicator, he sees the volumes of market buying and selling. This indicator expresses the activity of conducting transactions for the purchase or sale of assets. The calculation is as follows:
- First, the direction of the candle is determined. If the closing price is higher than the opening price, then it is bullish. If less, then bearish.
- The volume of transactions carried out during the time corresponding to this candle is considered. For bullish this value is taken with a plus sign, for bearish – with a minus sign.
- The resulting value is added to the previous value of the OBV indicator.
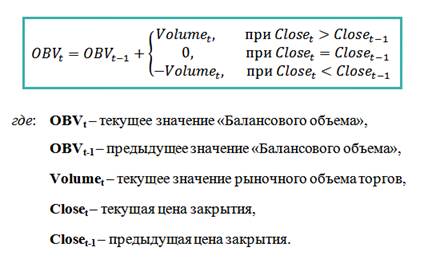
Calculation formula:
How to use the balance volume indicator, settings, trading strategies
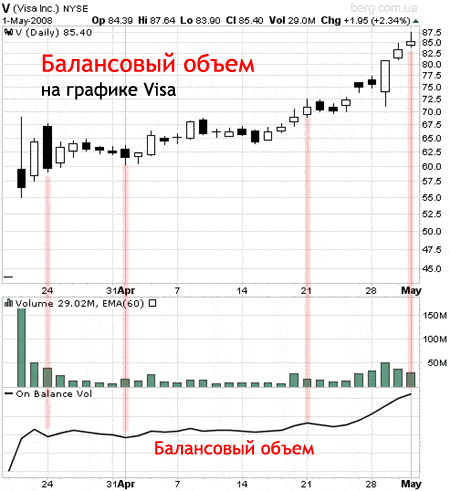
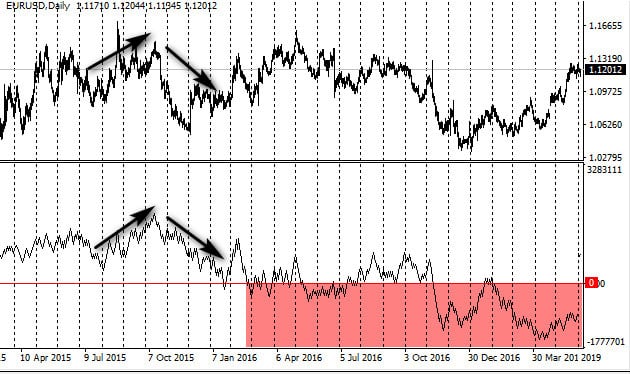
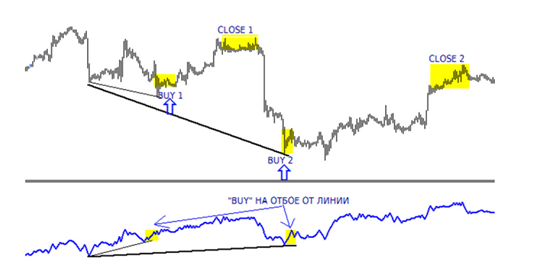
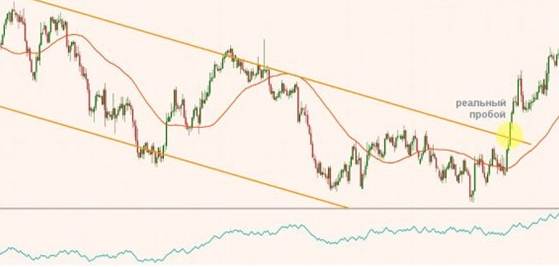
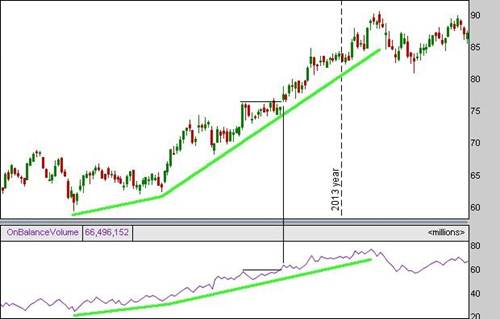
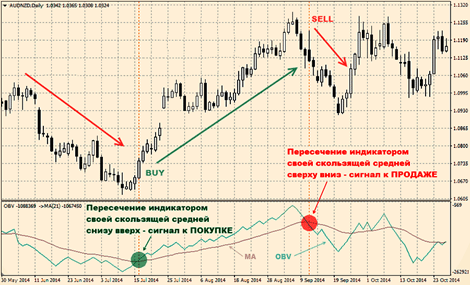
In most terminals, the indicator in question is one of the standard ones. It is a line whose values correspond to the volume of all transactions, which include both purchases and sales of securities. The method of use can be explained by the following example. If a trader sees an increase in stock quotes and at the same time fixes a growing OBV chart, then he has reason to conclude that the growth of quotations is stable. In such a situation, buying rather than selling shares will be more promising. On the other hand, if the OBV decreases with the growing chart, then this allows us to conclude that the trend is uncertain. If there were plans to buy the asset in question, then you need to analyze the situation again. Perhaps a more promising solution would be to wait for a trend reversal. If stock prices fall, then the fall of this indicator confirms the expectation that this process will continue. A decrease in the balance volume indicator indicates a low probability of its continuation. An important technique for working with this indicator is the use of divergence. Next, the technique will be explained using the example of a bullish trade execution. In this case, you need to pay attention to the following:
- During a downtrend, you need to draw a line connecting the peaks of the quotes chart, pointing down. The resulting straight line should go down.
- At the time points corresponding to these peaks, you need to pay attention to the OBV plot.
- You need to draw a line that connects the corresponding points. If it has an increasing direction, then we can conclude that there is a divergence.
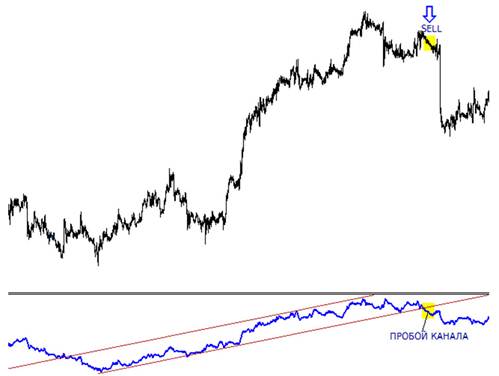
The above is explained in the following image. An example of applying divergence:
When to use OBV, on which instruments and vice versa, when not to use
Using the on-balance volume indicator is beneficial when there is an uptrend or downtrend. When lateral, it does not give reliable signals. When a trader using one of the signals of this indicator sees an opportunity to enter a profitable trade, he must wait for confirmation. It can be obtained using oscillator signals or after the appearance of the appropriate combination of
Japanese candlesticks . The simplest way is to check the closing prices of the next two or three bars. If they confirm the new trend direction, the trade is highly likely to be profitable. On Balance Volume (OBV) indicator – how to use the indicator in trading: https://youtu.be/_EP-klQaI90
Pros and cons
The strength of OBV is the lack of lag. Since no average values are used here, the resulting value will reflect the state at the current moment. This indicator creates reliable and distinct indications that can become a useful part of a trader’s trading system. One of the most significant is the use of divergence. OBV combines high efficiency and ease of operation. The disadvantage is that it is significantly less useful when working in sideways trends. The indicator does not contain information about asset prices.
Application in different terminals
The Balance Volume indicator is usually included in the standard set. In order to use it, you need to do the following:
- You need to select the instrument with which you will work, as well as specify the timeframe.
- Go to the list of available indicators for the terminal you are using, select OBV and activate it.
- Next, you need to enter the required parameters.
After confirming the input, the indicator will appear in a separate window. For the calculation, you need to specify what value of the bar is used. Normally Close is selected by default. On various terminals, the following may be used instead:
- The maximum or minimum value.
- Median price ( (Max + Min) / 2 ).
- Typical value is ( ( Max + Min + Close ) / 3 ).
- Weighted closing price ( ( Max + Min + 2 * Close ) / 4.
- Open – the opening price.
