The phenomenon where the price of a stock changes for one period each year is the seasonality of stocks. A trader, based on knowledge of changes, benefits by identifying the main development trends, identifying market opportunities at a specific time.
What is stock seasonality and how to use it in the stock market
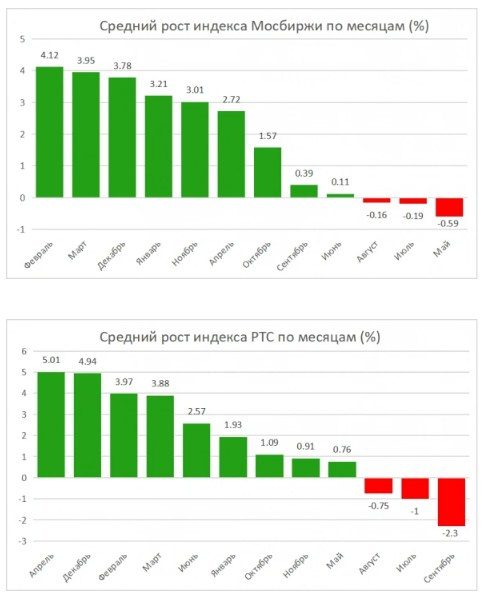
Two main components determine the situation in the stock market. These are financial performance and investor behavior. Analysis of events shows the absence of patterns for a long time. But a short period of similar phenomena in the stock market can be identified by determining the seasonality of stocks based on the behavior of investors. The habits of individuals who place capital change under the influence of many factors. Seasonality affects the value of shares due to a decrease in the activity of traders due to vacations, an increase in the efficiency of their work at the end of the financial year. Traders’ expectations are self-fulfilling, changing the situation in the stock market. Acting on his own initiative, the stock trader uses the charts of previous periods to analyze. The identification of changes in asset prices pushes traders into action in the same period. A pattern appears which is one of the factors that should be taken into account when working with stocks, but not used as a fundamental point for determining a development strategy. The seasonality of shares is typical for emerging markets, which include the Russian one. The depth and stability of investor behavior is characteristic of developed countries. In Russia, the main goal of traders is to obtain short-term profit based on speculation. Low liquidity increases the volatility of shares. A large investor sells securities, the rest join the deal. The stock market becomes vulnerable to external influences, which breaks stability. 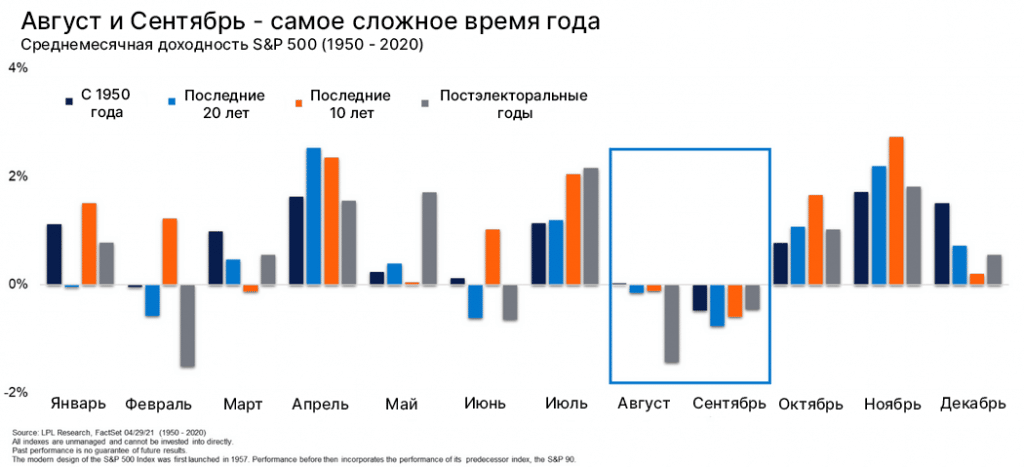
Characteristics of the seasonality of the market
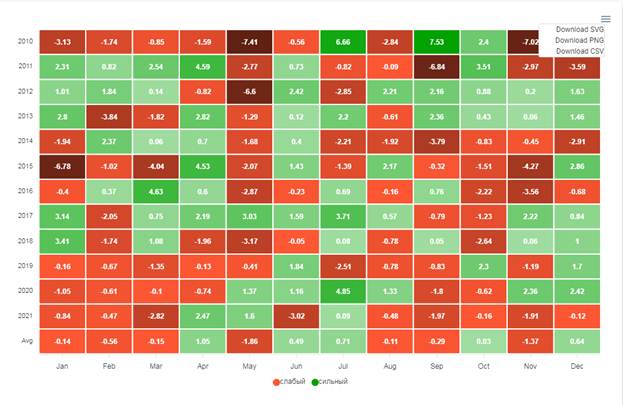
The seasonality of the stock market can be traced in the first quarter of the year. Over the past ten years, the price of securities has risen in the first quarter. This is due to the allocation of global funds during this period. Liquidity is boosted by funds from the Pension Budget, supplemented by December transfers from the federal pocket. Investor returns decline in the second quarter. The explanation for the trend is simple, is that new appropriations are distributed. The first public offerings are made at the beginning of the year, profits are fixed, after which a wave of sales occurs at the end of the first quarter. Studying the last decade, we can conclude that the liquidity of the third quarter is low. The summer months are a period of holidays, investors go on vacation, the seasonal factor in the market affects share prices. Things change in September there is a period of revival, characterized by new appropriations. In the fourth quarter, the US sets the tone for the Christmas movement. In Russia, the consumer is activated in the securities market. [caption id="attachment_391" align="aligncenter" width="601"]
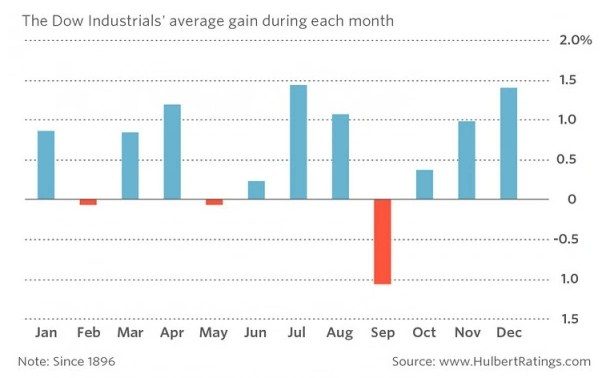
How to analyze the seasonality of stocks
When making forecasts, seasonal analysis benefits traders. The trading strategy is based on many years of experience in the stock market. The source of demand is all bidders: traders, investors, government agencies, pension funds. The task of the analysis is to identify the period when most stocks are in demand. The simplest approach is to calculate averaged data. The analysis process is as follows:
- Quotes have been studied for several years.
- The prices of each day are taken for addition.
- Prices are divided by a multiplier.
The graphic representation of the result obtained in the form of a line demonstrates the dynamics of prices for the selected period of time. A passing line next to it is the arithmetic mean, it is highlighted in a different color. 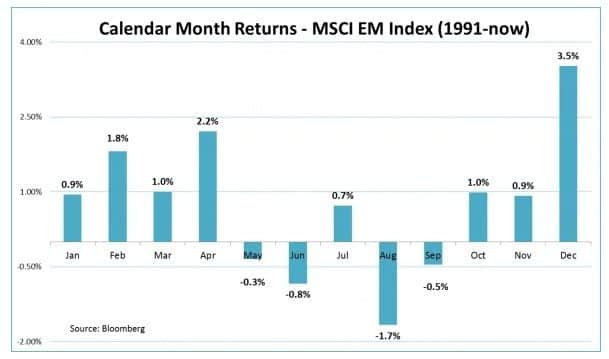
- Published opinions of analysts.
- Existing trend reports that are popular at this stage.
- Technical analysis charts comparing averages with actual numbers for a specific period.
- Analysis of companies a month before the publication of reports. Practice demonstrates the growth in the price of shares of successful firms before the start of the seasonal increase.
- Sector analysis.
- Analysis of changes in returns compared to the overall index.
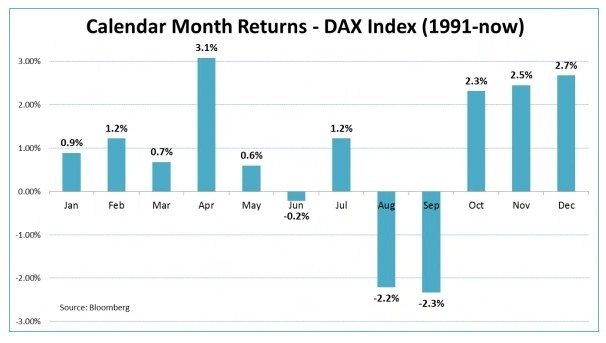
Practical Examples – How to Look for Seasonal Patterns in Stocks
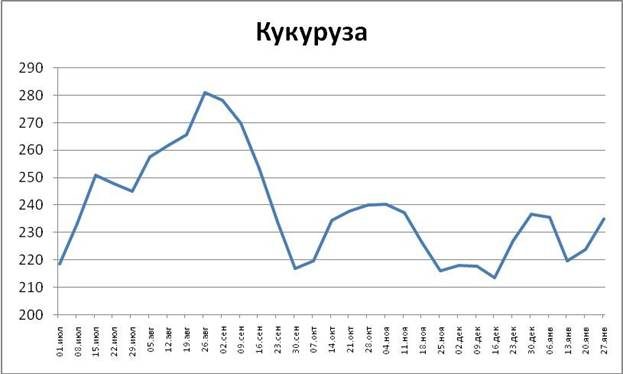
There are seasonal stocks in the stock market. Some of them are related to consumer behavior. For example, the tourism business is based on the desire of people living in the north to vacation in the Caribbean in winter. Buyers are active from November until Christmas. Builders are active in the summer. If we consider agricultural crops, for example, corn, then it must be taken into account that it is planted in the spring and harvested in the fall. At the time of harvest, there is always more of it. You can take into account such facts when concluding transactions on the shares of companies. Seasonal stock price trends develop as a result of events in the commodity markets. The mistake of traders is to misuse market dynamics. It is necessary to consider the price of securities without reference to specific dates. The general tendency of the predisposition to rise or fall must be the subject of study for successful action. 
- Determination of monthly prices with subsequent fixation of numbers in the table.
- Mathematical calculation of the average price for the year.
- Divide the monthly price by the annual average and subtract 1.
- Calculate the average for each month.
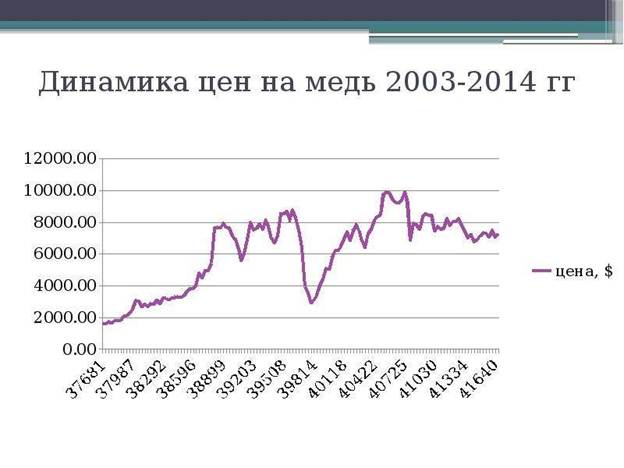
The built chart shows high prices for corn at the time of planting, low figures at harvest. Another example of the seasonality of stocks is the price of copper, non-ferrous metals, which depend on the activity of the construction industry.
