The use of price channels in trading, the construction and application strategy in practice. Any trader will tell you that
identifying market trends is the key to making money. Price channel trading strategies are a smart way to identify these trends as well as potential price breakouts and bounces over a given period.
Definition of a price channel and its essence in trading
The price channel used by traders to trade based on
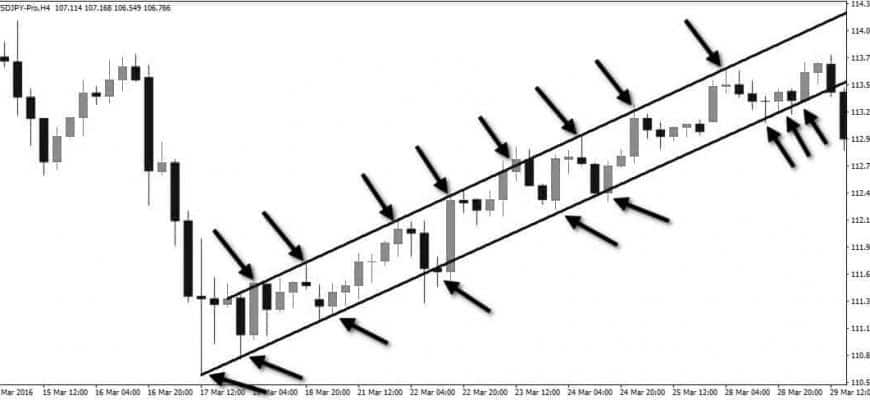
technical analysis is created by tracking the price of an asset. When studying technical analysis, it falls under the category of trend continuation patterns represented by two parallel trend lines (they look like a channel on the chart). The upper trend line connects the highs of the price fluctuations, the lower trend line – the lows of the fluctuations. It helps indicate the continuation of a bull or bear market. As a rule, traders try to trade within these lines, but the real money is made when the so-called “channel break” occurs. This means that the price moves sharply outside of what the price channel indicator predicts (in either direction).
support and resistance levels . The upper line of the channel represents the resistance line, while the lower line acts as the support line. 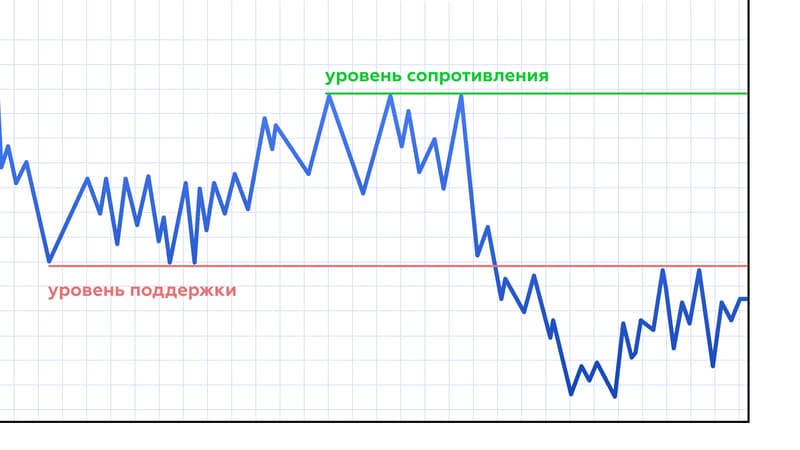
The channels are essentially a self-fulfilling prophecy. They work because many traders have identified them and use them to trade. The more traders identify the channel, the more often it will be used to enter and exit the market.
Channel Patterning
A trader establishes a price channel pattern if he detects at least two higher highs and higher lows. It draws a line connecting the highs and lows (to form a price channel pattern).
- Determine the maximum and minimum in the past. This will be the starting point of the channel.
- Find another subsequent maximum, as well as a subsequent minimum.
- Connect the two highs to draw a line called the “upper trendline” and connect the two lows to draw another line called the “lower trendline”.
- If the two connected trendlines thus obtained are almost parallel, a channel is formed.
- Thus, there are at least two contact points on the upper trend line, and at least two contact points on the lower trend line.
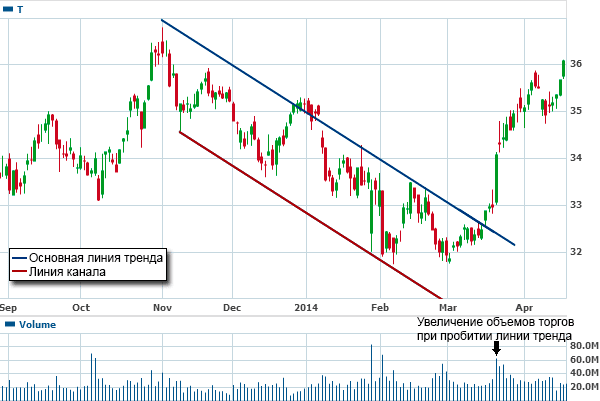
Attention! It doesn’t matter which price channel you are in, as soon as two highs are seen that do not reach the top of the price channel, the price will soon break down. Likewise, with two lows that do not reach the bottom of the price channel pattern, price is likely to break lower. The larger the gap between the price breaking through the resistance line, the higher the probability of opening a trade.
The worst mistake a trader can make is to enter a trade before the price breaks one of the channel lines. Entering a trade too early can cause the price to return to the channel. It is always important to wait for a confirmation of the breakout (when the price breaks the upper resistance level or the lower support level).
Channel types
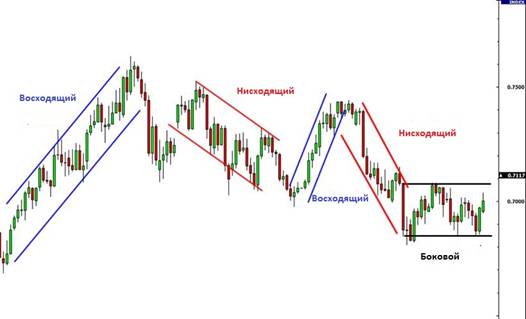
For most traders, ascending and descending channels are preferred. How “best” they are or not is a subjective question, but, nevertheless, these patterns are the standard when it comes to channel trading and the analysis of trading channel indicators.
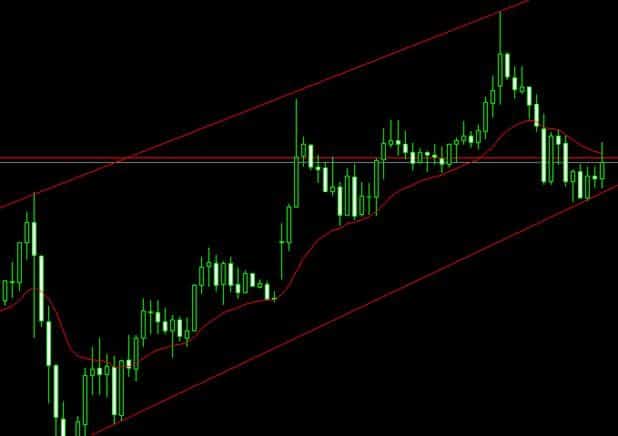
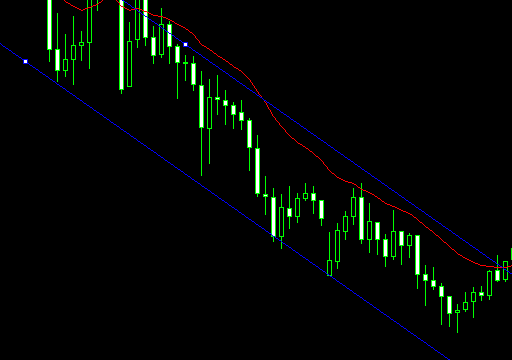
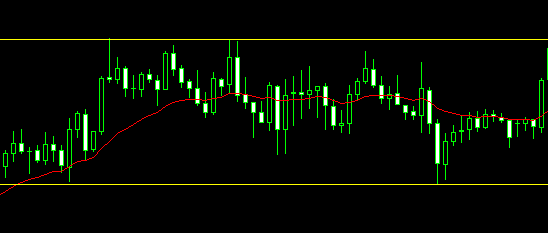
Regardless of the trend, it is important that the lines are parallel to each other. Drawing lines at the wrong angle will lead to false conclusions.
Trading Solutions
An asset moves through a price channel when the underlying price is buffered by the forces of supply and demand. They can move down, up or sideways. The culmination of these factors pushes the price action into a tunnel trend move. When there is more supply, the price channel tends to decrease, more demand tends to increase, if the balance of supply and demand is sideways. Traders usually look for assets that trade within a price channel. When they are trading at the high end of the price channel, it indicates that the stock is likely to trade down towards the center, and when the stock is trading at the bottom of the price channel, it indicates that the stock is likely to trend higher:
- The easiest way to use a trading channel is to assume that the traded asset will stay within certain boundaries . Thus, a trader trades short whenever the price hits the upper limit and long trades whenever the price hits the lower limit.
- Another way is breakout trading . As soon as the candle opens and closes outside the channel – a long trade when the upper limit is broken and a short trade when the lower limit is broken. When price breaks out of a channel, many of those breakouts can be false. To avoid this, before entering the market, you need to wait for the candle to close outside the channel or, in general, to retest the trend line.
- Another possibility when working with price channels is to use them as a guide for analyzing multiple timeframes . This means that if the asset is trading near the upper limit on a longer time frame, it is possible to enter short trades on lower time frames with a tight stop loss. Similarly, you can open long orders on a smaller time interval when the price is approaching the lower limit on a longer time interval.
How to build price channels, application in trading: https://youtu.be/iR2irLefsVk Volume can also provide additional information when trading these patterns. Volume is invaluable when a breakout of any of the two-channel patterns up or down is confirmed. If volume is missing along with pattern breakouts, then the resulting trading signal is not as reliable. It has been observed that a false breakout of a pattern occurs when there is no higher volume in the process of the breakout. Ultimately, whether an investor trades bullish or bearish in a down/up channel is entirely up to him and the strategy he thinks best suits his needs at the moment. Technical analysis of both downstream and upstream channels, as a rule, advises investors/traders to buy (or go long) an uptrend asset and sell (or go short) in a downtrend. However, how much they should subscribe to this idea and how long they should follow the trend is entirely up to them. This is why the analysis and accurate calculation of trading channels and trend lines is vital as it gives traders a basis to formulate and facilitate financial decisions. https://articles.opexflow.com/analysis-methods-and-tools/price-channel-indicator.htm as it gives traders a framework to formulate and facilitate financial decisions. https://articles.opexflow.com/analysis-methods-and-tools/price-channel-indicator.htm as it gives traders a framework to formulate and facilitate financial decisions. https://articles.opexflow.com/analysis-methods-and-tools/price-channel-indicator.htm
Pros and cons
Channel trading is used in almost every form of technical financial analysis for a reason, as it provides investors with the easiest way to use data in their trading decisions. Also, at least at first glance, the price channel does not require much research, knowledge of mathematics or other forms of analysis, although, of course, there are nuances. So:
- The main benefits associated with price channel trading include high returns, minimal risk, and high diversification.
- Among the disadvantages are volatility, human factor, false signals.
Price channel trading can be highly
volatile and unpredictable in price movements, especially when used over a shorter period of time. Despite everything, errors can still affect the data provided by channel trading indicators, although this is obviously somewhat mitigated by the applied parameters of the indicator in question. But it’s foolish to dismiss the possibility of error, since accurate technical analysis requires years of study (to develop the knowledge of how to spot these errors).
The price channel, like any technical analysis indicators, can be associated with false positive/negative signals that can be misleading. For this reason, all indicators should be used in combination with others, providing the most accurate and in-depth analysis.
Trading channels are an integral part of price analysis. Without such concepts, investors would make important financial decisions blindly, subject to the bizarre movements of an indifferent market. Only by carefully studying past price fluctuations and identifying the root economic causes of these shifts in the supply/demand chain allows traders to successfully formulate and execute winning strategies.
