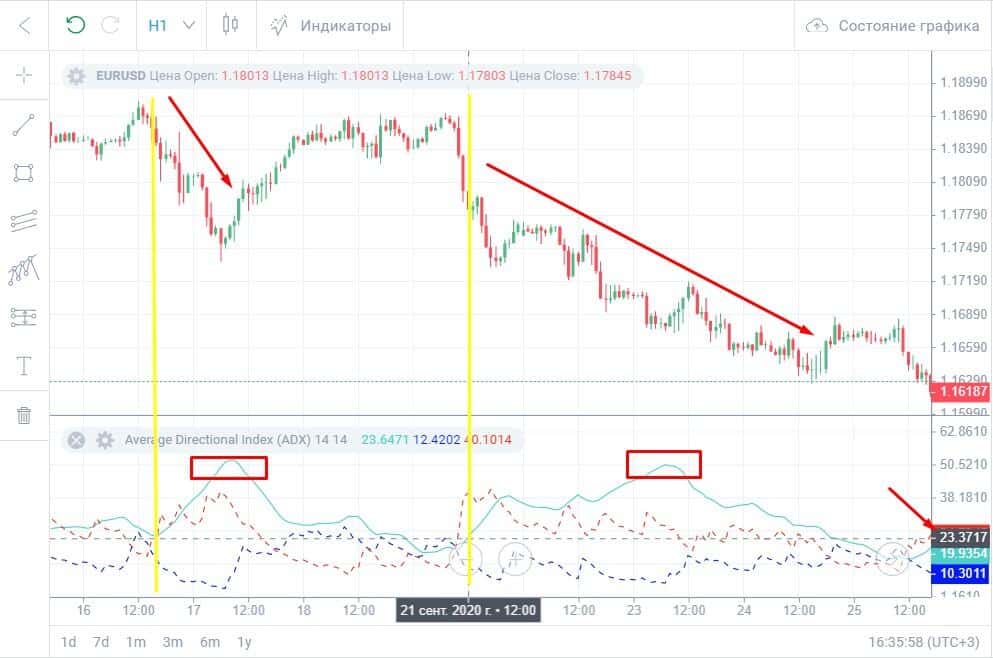
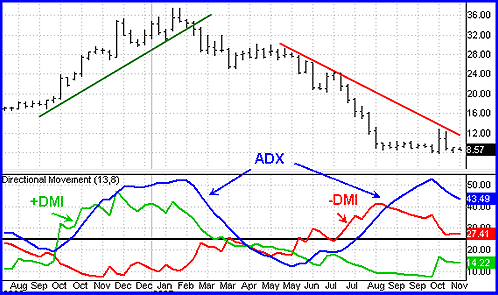
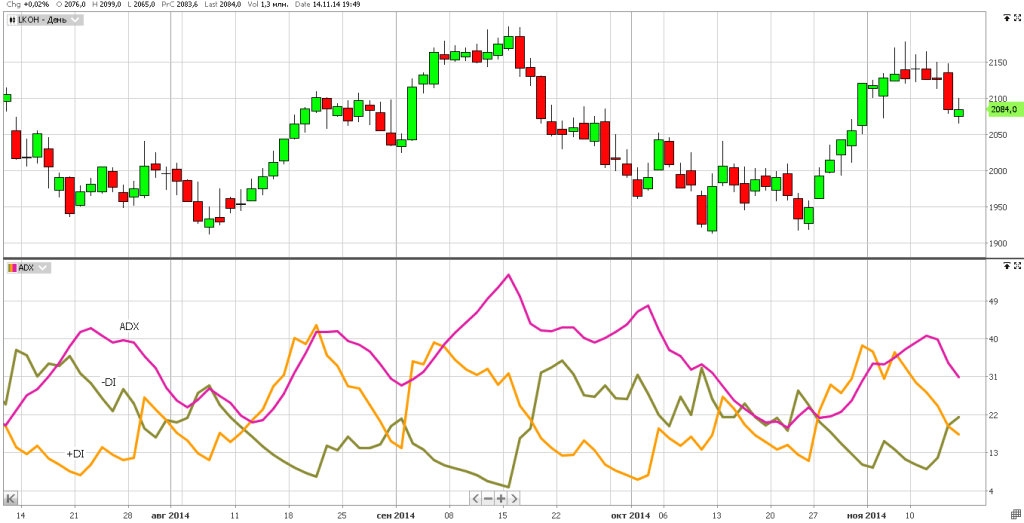
ADX indicator – what kind of indicator and what is the meaning, calculation formula. ADX is used to determine the presence of a trend and its characteristics. The indicator was proposed by the American trader Wells Wilder in 1978. ADX was discussed in detail in his book New Concepts in Technical Trading Systems. One of the features of the indicator is the presence of three curves (+DI, -DI and ADX) on it at the same time. By analyzing these charts, the trader receives signals that allow him to make profitable trades.
- Determination of the market structure.
- Looking for opportunities to enter a trade.
- Accurate determination of the moment of entry into the transaction.
- Calculation of the purpose of the transaction (exit points with profit).
- Risk management, including finding the price level at which a losing trade is closed.

- It is necessary to compare the maximum value of the current bar and the previous one . If it is greater, then the difference between them becomes the current value. Otherwise, a value of zero is considered. The value thus calculated is assigned to the +DI1 indicator at the point in question. These values will be used to calculate the +DI graph.
- You need to calculate the value -DI1 . To get it, you must perform the following steps. It is required to compare the minimum value of the current bar and the same value of the previous one. If the first is less, you need to determine the absolute value of the difference between them. If the condition is not met, the value is assumed to be zero. Based on such data, calculations will be performed, with the help of which a -DI graph will be made.
- For each bar, it is necessary to compare the received values +DI and -DI . Whichever is smaller is taken equal to zero. If these values are the same, then both take the value zero.
- Now you need to calculate the following three values by absolute value : the difference between the maximum and minimum values of the current bar (High−Low), between the maximum and closing price of the previous bar (High−Close(i-1)), the closing price of the previous bar and the low of the current one ( Low-Close(i-1)). The maximum of these values will be assigned to the TR parameter.
- Find +SDI = (+DI1) / TR and -SDI = (-DI1) / TR.
- To plot +DI calculate the exponential average of +SDI for a given number of bars . The -DI chart is obtained as the exponential average of -SDI over the selected number of bars.
- Further calculations are carried out based on the values of these two graphs. In this case, ADX1 = ((+DI – (-DI)) / (+DI + (-DI))) * 100% .
- The indicator value is defined as an exponential average of ADX1 for a given number of bars.
How to use the ADX indicator, setup, trading strategies
The indicator takes values between 0 and 100. However, in practice it rarely reaches extreme values. It is generally accepted that a value that does not exceed 20 indicates weakness. If the indicator exceeds 60, then we are talking about a strong and dynamic trend. Experienced traders choose the signal level they need based on their experience and knowledge. In the standard case, the Close price is used for calculation, which is not recommended to be changed. Choosing your own option for this makes sense only in cases where the trader has good reasons for this. The duration of the calculation period should be suitable to cover the desired portion of the schedule without causing excessive delay. In most cases, a value of 14 bars is used, which in most cases is set by default.
When to Use
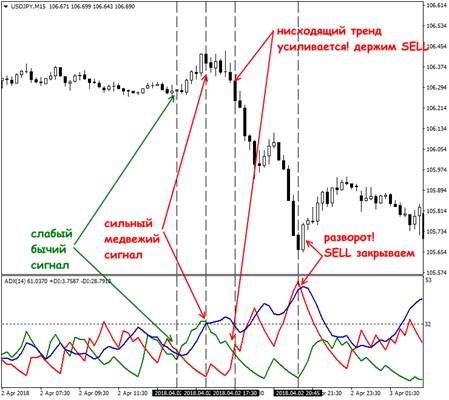
The ADX indicator is designed to be used during trending movements. During the flat, its use will be ineffective. Since its application allows analyzing only the structure of the market, it will be necessary to supplement it with one or more other indicators in such a way that it would be possible to build an effective trading system on their basis. Examples of using the indicator: Indicator
Pros and cons of application
The advantage of this indicator is the ability to determine the strength of the trend. This will allow you to enter a trade during the initial stage of the trend and exit it when it ends. The indicator helps the trader assess the relative strength of bulls and bears on the stock exchange, allowing a better understanding of the reasons and prospects for the price movement of the instrument. The disadvantage is the delay associated with the fact that the calculation uses the calculation of average values. If the calculation period is shortened, the response will be faster, but the number of false signals will increase.
Application in different terminals
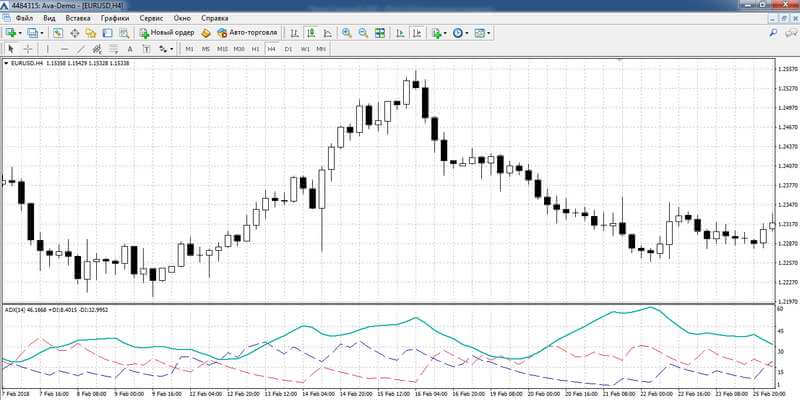
This indicator is included in the number of standard indicators for most indicators. In the Metatrader terminal, working with it is as follows. Indicator parameters:
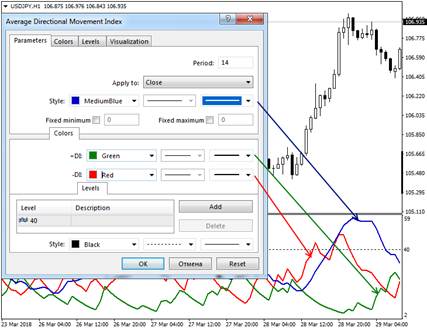
- In the main menu, you need to click on the “Insert” item.
- In the menu, select the line “Indicators”. In the submenu go to “Trend”, then to “Average Directional Movement Index”.
- After that, a window for entering parameters opens. In it, you need to specify the calculation period, the price at which the calculation will be made. In the standard case, Close is used here, however, if desired, the trader can use other options: Open, High, Max, Min, Median Price, Typical Price or Weight Price.
- Next, you can select the type, thickness and color of the graph lines. For the convenience of analysis on the chart, you can set those horizontal levels that the trader considers significant.
- By default, the chart will be shown for all used timeframes. If desired, the user can select only some of them.
