
Technical analysis in trading – basics and methods, directions of technical analysis, figures and patterns in analysis with explanations and images.


- Where is technical analysis used and what is the purpose of its use in trading?
- Directions of trading technical analysis
- Figures and patterns of technical analysis in trading with an image: what is it and what is their meaning
- Indicators: what are they and how are they used in graphical analysis?
- Technical Analysis: The Basics for Beginners
- Market analysis: technical or fundamental method
- Fundamentals of technical analysis
- Standard Analysis
- Graphical analysis using indicators
- Study of full volumes
- Market analysis with candlesticks
- Fundamental analysis: what is its essence
- Tools used in technical analysis
- How to conduct technical analysis: step-by-step instructions for analyzing the exchange and financial market industries
- Trend trading
- Breakout trading
- Advantages and disadvantages of technical analysis
Where is technical analysis used and what is the purpose of its use in trading?
Technical analysis is relevant and used in the field of stock trading, where stocks, various goods, financial assets, bonds, options and other financial instruments come into circulation, the price of which is set naturally in the course of supply and demand. In technical analysis, price patterns are a combination of the opening price, closing price, high and low points by candlesticks for a certain asset over a certain period of time. The time interval can be either intraday (from 1 minute to several hours), or daily, weekly, etc. https://articles.opexflow.com/analysis-methods-and-tools/yaponskie-svechi-v-trajdinge.htm To analyze stock trading trends and the market as a whole means to identify the current trend and be confident in your assumptions regarding the further price development , using graphic tools. Therefore, the main goal of technical analysis is to determine the right moment to enter a trade, having seen the resolution for this on the charts themselves.
Directions of trading technical analysis
Technical analysis in trading has two main streams:
- Definition of typical cases corresponding to certain figures or their combinations.
- Application of graphic data.

Figures and patterns of technical analysis in trading with an image: what is it and what is their meaning
Supporters of the use of
figures and patterns in technical analysis are sure that volatility, movement and change in price patterns are a natural process for the financial market. Graphic images, first of all, allow you to visually recognize the movement of prices – trends. In addition, dynamic trend lines (support and resistance) can be seen on the charts. These are the stages below which the pattern cannot drop at the moment (support level) or above which it cannot rise (resistance level). 


Indicators: what are they and how are they used in graphical analysis?
In the second course of technical analysis, specialized graphic elements are used – indicators. This tool gives a specific sign confirming the reasonableness of buying/selling assets. Visually, the indicators look like graphic images, calculated and formed as an addition to the price module. They are built according to the average value of prices or the trend of their change. Indicators are located either next to the price module chart, or in the format of a separate interactive fluctuating chart in another tab. Regardless of the display option, the main task of this tool is to stabilize, select random volatility and clearly indicate the trend by price module in the market at the current moment.

Reference! The easiest to learn and set up and, according to numerous tests, the most reliable charting tools are moving average lines, that is, charts that display the average value of the price module over the last period of time.

Technical Analysis: The Basics for Beginners
There are three main provisions on which the whole essence of technical analysis is based:
- Everything is included in the price . It is necessary to understand and be aware of what a specific price of a financial asset is currently arising from. The followers of this method of analyzing exchange trading argue that all the latest updates, all fluctuations of the parties on the exchange (sellers-buyers), all organizations that control the work of financial enterprises and the expectations of participants in exchange trading – everything is part of the current price. It is important to realize this and only then enter the stock exchange.
- The movement of the price module depends on the current trend . The module is not inconsistent and changes not on a whim, but based on specific reasons. The clearer they are, the faster this change will be caught by a participant in exchange trading. All participants are people, therefore, they aim to make a good deal. Thus, supply is formed, and demand follows from it – the main mechanism of the market. This is how trends are formed.
- Price movement, according to history, is periodic . It is difficult to point out the reason for this: perhaps the point is in the psychological scenarios of human behavior. From here, automatic actions follow: if the situation on the market is unstable, assets are sold, if the situation is calm, they are bought. There is also an opposite effect – the price module increases when a signal is given, read by all traders and investors, to buy an asset.
Basics and methods of technical analysis in trading – training for beginners and advanced traders: https://youtu.be/uwxmyD-qQtU
Interesting! Frequent changes and development of the market no longer surprise anyone, so keeping track and trying to keep up with the new habits of the exchange is difficult, but no less interesting!
In addition, technical analysis can be used in relation to any financial instrument. There are more convenient assets that can be processed and controlled, and there are less “Technical” ones, but this does not mean that they cannot be followed.
Market analysis: technical or fundamental method
There are several ways to analyze the cryptocurrency market, and if you are rushing about in choosing, use both! In both methods, there are elements that are necessary when working with financial instruments. Let’s analyze each method in more detail.
Fundamentals of technical analysis
Classic technical analysis is based on the following research categories:
- standard analysis – reveals possible options for changing price modules using a visual method – patterns and lines are outlined on the graphical display of prices;
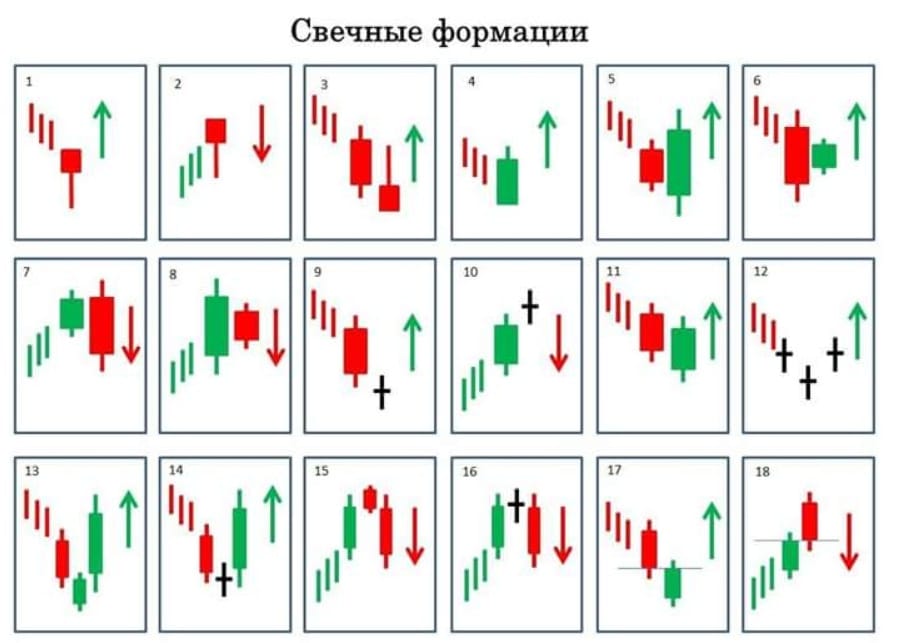
Types of candlestick patterns - graphical analysis using indicators – reveals options for changing the price module using mathematical calculations;
- study of full volumes – determines the probability of a change in the price module in the future from the standpoint of the number of transactions executed with a financial instrument that led to price changes;
- market analysis using candles – considers the likelihood of price movement based on a combination of Japanese candlestick elements.

So what is each category of research.
Standard Analysis
The meaning of the method is that a chart of price module lines is formed, which starts trends and indicates the directions in which the price will change, as well as its levels, indicating areas where participants in exchange trading are most involved – this behavior characterizes probable options for continuation, uncertainty or reversal current trend.

Note! Before using this type of analysis, make sure you have sufficient knowledge. Even minor mistakes can lead to serious losses.
The flag and the pennant are responsible for the continuation of the trend. They are formed on the graphic image as follows: large traders or investors want to purchase a financial instrument on favorable terms, if the price module changes its position along the trend with little or no obstacles and remains stable in its changes (from the standpoint of technical analysis of the price, its basic factors are also taken into account ). Thus, on the chart, such patterns are displayed by unexpected sharp jumps in price (poles), later positions (panels) are reached, then an impulse is given that determines the width of these two elements.

triangle. It is formed when the market establishes equality between buyers and sellers, when it is not known which side will outweigh and in which direction the price will move further. On the graphical display, the triangle is made up of minimum and maximum values, as well as a fading amplitude of changes, which indicates that one side of the participants is inferior to the other.


Graphical analysis using indicators
The category of indicators includes mathematical methods for identifying both unreasonably high (overbought) and unjustifiably low (oversold) price modules in relation to past movement ranges. Any trend has both a period of growth and deceleration / decline in development. Therefore, one can buy a financial instrument at a favorable price in an upward trend and then resell it at a high price, or buy an asset at the most attractive price using oscillators. The basic oscillators (indicators) are the Relative Strength Index. They indicate the price conditions within the established and changing ranges of the price module volatility, both up and down.

Reference! Leading oscillators and indicators are often mixed with each other, getting effective combinations for filtering work in the stock market. Separately, oscillators are used for a specific selection of the most attractive value.
Study of full volumes
The study of trading volume in the market has recently gained popularity. Trading volume analysis can be carried out in standard TA or using new methods: cluster analysis and the study of horizontal volumes.

Market analysis with candlesticks
This method of analysis originated in the Middle Ages and was invented by the Japanese trader Munehisa Homma. The principle of candlestick analysis is that some forecasts are made regarding the price module using combinations of Japanese candlesticks in relation to each other. This option also involves the work of individual candlestick elements that indicate a certain meaning depending on the location of the trend at the moment. The logic of candlestick analysis lies in informing the exchange trading participant of the power balance of the stores when the opening and closing prices are equal.

Fundamental analysis: what is its essence
Financial and exchange niches have the property of spontaneity: even the most insignificant situations, changes or troubles necessarily lead to an unbalanced state of the price module – the exchange rate changes, quotes change. Such situations may have a long-term perspective (economic crises), or they may end in a few moments – the period of such fluctuation depends on the scale of the event and how it affected financial resources. Fundamental analysis in trading is a way that allows stock traders to change their behavior during the transaction. Fundamental analysis requires a constant flow of new information, as well as a sufficient amount of knowledge and a real clear intuition of a participant in exchange trading. Given this, it is important not only to be able to quickly find and process news information,
Tools used in technical analysis
Technical analysis is good because for its implementation a trader can use any convenient and effective tools regarding his work, since there are quite a large number of them. However, linear instruments have been leading in the exchange industry for a long time. Linear TA tools include a set of lines: vertical, horizontal and trend lines.

Interesting! Some participants in exchange trading draw levels at an angle – the higher the degree of the angle, the greater the trend is gaining strength. Therefore, a line drawn at a 45° angle is considered a strongly directional trend.
How to conduct technical analysis: step-by-step instructions for analyzing the exchange and financial market industries
The bulk of trading algorithms are part of one of the following categories:
- trend trading;
- breakdown trading;
- trading in a stable direction;
- counter trend trading .

Trend trading
In this industry, the winning formula is: trend + significant area + entry signal.
- trend . Here it is more profitable to use moving average lines.
- Significant area is horizontal levels, trend lines or moving averages.
- Entry signal . As a signal for entry, you can use any method of market analysis presented above. For example, it will be candlestick analysis.
Breakout trading
Fluctuations in the price module are not consistent, they do not have a definite pattern. Periods with slight price fluctuations are replaced by times when the price module jumps up and down. This indicates that the best time for breakouts is a period of low price fluctuations. Pattern:
- We determine the level of price fluctuation: high volatility of the price module or low. For these purposes, you can use the ATR oscillator, it allows you to determine the state of the exchange at the moment. The period of low fluctuations indicates that the market is waiting for innovations soon.
- We are waiting for the signal to enter.
Advantages and disadvantages of technical analysis
Like any method used in the financial market, the TA process has its advantages and disadvantages. Strengths:
- TA can be used in relation to any financial instruments and in any niches: it is suitable for both currency and stock exchanges of various countries of the world;
- the use of charts allows the trader to separately analyze any period of time – from 60 minutes to a century;
- the methods used in technical analysis are based on the actions taking place on a real exchange;
- All information used in TA is up-to-date.
Weak sides:
- subjectivity. The views of two different participants in exchange trading on a certain situation can be completely different, and a novice trader can easily notice what he wants to see, and not the real picture that is currently happening in the market;
- TA says only indicates some probability that an event will occur, but does not give specific guarantees that it will happen;
- technical analysis is based on mathematical operations, so for beginners who may not have enough knowledge and skills, this way of analyzing the market will seem complicated and overwhelming;
- technical analysis is based on up-to-date information and fresh news, so it is important to be able to quickly find, process news and use it in the period of its relevance.


стадии освоение.изучаю