
Figures and indicators are the main assistants for a trader in predicting the direction of price movement. And if indicators tend to be late with readings, then the figures most accurately work out their purpose. The article provides a detailed analysis of what a “flag” figure is, its formation rules and varieties of manifestations on the graph. Additionally, the main differences from related figures, several trading strategies, and risk accounting rules are described.

- Figure “Flag” – description and meaning of the pattern in trading
- Visual figure definition
- The constituent elements of the figure “flag”
- Types of flag figures – bearish, bullish and other patterns
- Bullish flag in a downtrend
- Bear flag in an uptrend
- The main differences between the flag and other patterns in trading
- Practical application of the flag pattern in trading
- Strategy 1
- Strategy 2
- Strategy 3
- Advantages and disadvantages
- Mistakes and risks
- Expert opinion
Figure “Flag” – description and meaning of the pattern in trading
The flag is one of the elements of the formation of the continuation of the trend direction. The main distinguishing features of the pattern are:
- Absolutely even formation between the support and resistance lines.
- Direction angle against the trend.
- Formation after impulse movements.

The flag is a volume accumulation figure. It is formed after sharp, large jumps in the direction of the trend.
Visual figure definition
Determining the flag pattern on the chart is quite simple. The main thing is to accurately select the movement preceding the figure, followed by a slowdown:
- The formation begins with a sharp price impulse of the price. At the same time, the candle contains the maximum volume that is spent on this movement. This is how the “pole”, “flagpole” or “handle” of the flag are formed.
- After using up the volume, the price meets resistance from opposite market participants and rolls back, up to ½ the height of the previous impulse. This is how the price minimum or maximum of the flag is formed (depending on the trend).
- Then the price moves from support to resistance at an angle, while maintaining an accurate and parallel range.
After several formations of lows and highs, the price breaks the flag and continues the trend direction. This happens due to the appearance on the market of new and sufficiently large price volumes.
The constituent elements of the figure “flag”
The flag shape consists of the following elements:
- “Shaft” – is formed from the last impulse candle.
- The first rollback is formed due to a lack of volume and resistance from opposite market participants.
- Support and resistance line – which form an equidistant channel and keep the price in the range.
- The angle of inclination against the trend . Allows you to define a shape as a flag.
- The range is the height of the flag. Often the range of the pattern is formed by the height of the pole and is ½ or 1/3 of this height of the impulse candle.

Types of flag figures – bearish, bullish and other patterns
There are two main types of flag pattern:
- Bear flag – formed by sellers in an uptrend under the influence of buyers.
- Bullish – founded by buyers in a downtrend under the influence of sellers.


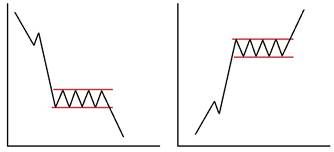
Bullish flag in a downtrend
The bullish flag pattern, in a downtrend, is formed at the expense of buyers, but under the influence of sellers. The figure is formed as follows:
- In a downtrend, a large price volume is injected or its remainder is activated. This contributes to the formation of a large momentum candle, which often breaks through an important price low. This is how the “pole” of the flag is formed.
- Due to the full consumption of the volume, the price meets the resistance of buyers, with the further formation of the first pullback maximum.
- The weakened influence of sellers, but in the presence of a small volume, allows you to create resistance and continue to push the price down. This forms the second support point.
- The second point of resistance occurs above the first. This is due to the desire of sellers to overestimate the cost and continue the downtrend from the most favorable price in the current time period. At the same time, insufficient volume does not allow breaking through the support. So there is a new price low, which is higher than the previous one. Buyers are trying to gain a foothold in higher positions.

- Fixing at a higher asset value in the area of resistance.
- A set of the largest volume, which will allow breaking through the support line.
All this time, shadows appear in the area of support and resistance, which break through the established levels. The concentration of such shadows increases in the support area, indicating an imminent breakout.
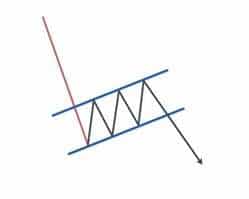
Bear flag in an uptrend
In an uptrend, the flag appearance logic is reversed:
- The “pole” of the figure and the first point of resistance are formed by injecting the maximum volume to secure a higher and more expensive price position.
- Then there is a rollback of value, due to the influence of sellers. Buyers cannot continue the trend due to the lack of volume, and sellers create resistance and pullback with their low volume. The first point of support is formed.
- After fixing a support point, the bulls push the price up with a little volume, thus maintaining their positions and fixing a new high, which is lower than the previous one.
- Bears increase the pressure, but the lack of energy and the resistance of buyers do not allow them to break through the support level. At the same time, the bulls receive the lowest value of the asset at a given time.

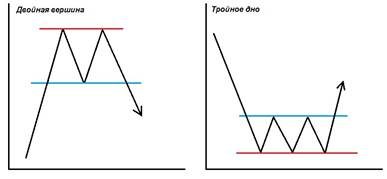
The main differences between the flag and other patterns in trading
Various figures are used in the technical analysis of the markets. In this case, it is worth considering their orientation and formation geometry. From such figures as:
triangle , wedge and pennant, the flag differs primarily in the symmetry of the range. Its support and resistance lines are equidistant from each other, not narrowing in the direction of price movement. 


- Rectangle . Also a trend continuation pattern. The pattern differs from the flag only in that it is formed exactly horizontally, without a slope against the direction of movement.
- Channel . Here you can find almost complete similarity, with the exception that the channel is not formed due to sharp impulses. The formation of this figure is preceded by a sluggish movement in the direction of the trend, with some resistance from opposite market participants. When the trading volume is completely spent, the channel forms a protracted movement within its range.
- Vertex . Also similar to the channel and the flag. The difference is that the top is formed strictly horizontally and is a figure of a change in the direction of the trend.


Important! Building a figure can be most accurate only after the two points of support and resistance are fully fixed. Only in this way it is possible to determine with certainty the given formation, its range, the angle of inclination and the presence of an equal removal of support and resistance.
Practical application of the flag pattern in trading
Next, 3 main strategies based on the flag pattern will be considered. The strategies are described on the example of a bearish formation in an uptrend.
Strategy 1
This trading method will allow you to find a new price point to open a trade. The strategy also provides an opportunity to buy additional volume by opening a position at a lower level:
- The price met resistance from sellers after a sharp upward momentum. Then there is a rollback in the opposite direction. The first highs and lows of the price are formed.
- Further formation of the range occurs due to two more fixed points of support and resistance. The second maximum is formed on the chart, lower than the previous one and the second minimum, which also sank relative to the previous one.
- It is required to set a resistance line at the highs, and a support line at the lows.
- A pending order to buy is set at the level of the first high.
- In the center, between the first high and low, a stop loss is set.

Strategy 2
This trading method allows you to enter the market from the lowest price point in the flag’s range. The advantage of the strategy is that it can be supplemented with
Fibonacci levels .
- On the price chart, fix the presence of the flag pattern and highlight it with support and resistance lines for 4 touches (2 from above-2 from below).
- Further, from the first high to the first low, stretch the Fibonacci level.
- A grid will be formed, on which levels: from 23 to 61 will indicate the point of formation of the next minimum.
- Entry into the market is carried out from level 23, stop-loss is set at a distance of 10 or more points.

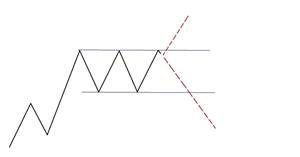
Strategy 3
This strategy is similar to the first one, but differs in that the deal is made manually, without a pending order.
- It is necessary to wait for the formation of a bearish formation, consisting of 2 points of support and resistance.
- A buy trade is opened when the resistance level is broken and a new candlestick is formed in the direction of the trend.
- Stop loss is set behind the broken level, at a distance of more than 10 points.
This technique allows you to reduce risks and open a position with a quick impulse breakdown of the formation.

Advantages and disadvantages
Using the flag formation in technical analysis has its advantages and disadvantages. Among the advantages can be identified:
- The formation indicates the continuation of the current trend.
- Allows you to find the most accurate point to enter an additional position.
- Gives you the opportunity to trade on a breakdown, using pending orders.
The figure also has flaws.
- It requires an accurate calculation of the stop loss setting.
- It may take a long time to form.
Despite the shortcomings, the flag significantly reduces trading risks, allows the trader to assess the situation and determine the priority of market participants.
Mistakes and risks
When trading inside the formed flag and at the time of the breakdown, the trader should consider:
- The deal is at the support level (uptrend) when the third point is fixed. The second touch of support, in an uptrend, will only indicate the formation of a flag figure and an equidistant range.
- The construction of limit lines is performed only by the bodies of the candles. Shadows indicate only the momentum strength of market participants.
- Stop loss is set behind the previous levels and long shadows. For an uptrend, when opening a buy trade from the third touch, the stop loss is set below this point, at a distance of 10 or more points.
There is a lot of risk in trading this formation if it is formed on a higher time frame and traded on a lower time frame. For example, in an uptrend and a bear flag on the hourly chart, this formation forms a long downtrend over a five-minute time frame. Trading on the 5-minute timeframe, downward, becomes as risky as possible due to a sudden reversal (breakdown of resistance at H1). The flag pattern – a complete guide to trading the flag pattern: https://youtu.be/ER5tCzKbPrI
Expert opinion
The flag figure is actively used by traders to make deals in the direction of the trend continuation. This formation allows you to reduce risks and make the most accurate deal. Another reason for using it is the fact that when an important level is formed in the area, the formation indicates its breakdown. This saves market participants from transactions for a trend reversal. The flag formation is useful in technical analysis. For beginners, it allows you to more accurately determine the priority and strength in the market, increase their experience and statistics of successful transactions. When trading in the range of this figure, the main thing is to follow the rules of risk management and wait for the exact location of the touch points.


