
The use of a triangle figure in trading, how to trade a pattern, what types of triangles on charts are analyzed in technical analysis.In technical analysis, there are simple but effective figures that are used by both beginners and professionals. One of these shapes is a triangle. If a trader gets stops time after time, it is worth trying to find a triangle, 95% it will be found. After that, it is clear that on the working timeframe, a flat is a trade between resistance and support. The appearance of a triangle indicates uncertainty in the market. The figure can speak both about the continuation of the directional movement in the same direction, and about the trend change. It is recommended not to trade within the boundaries of the triangle; after its identification, you should wait for a breakdown and open a deal in the direction of the trend. Trading on triangles requires experience, you need to keep in mind many nuances.

- What is a triangle in trading, application in technical analysis
- Types of triangles in trading – analysis on charts
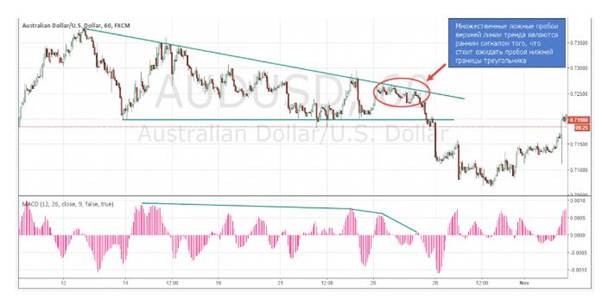
- Descending triangle on the chart
- ascending triangle
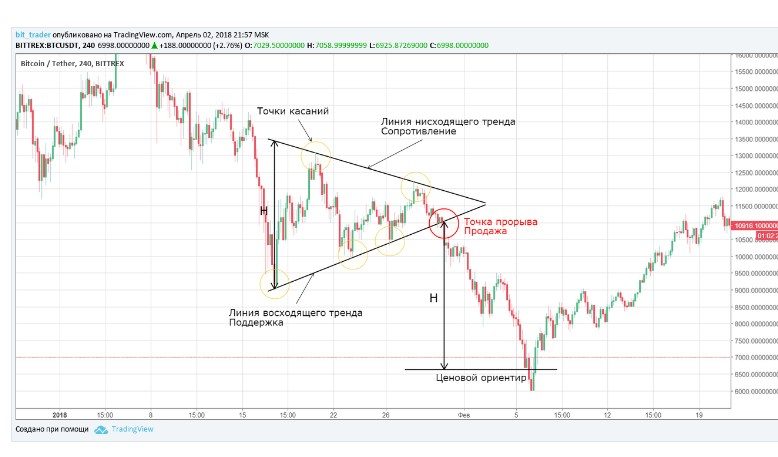
- Symmetrical (isosceles) triangle
- Expanding triangle on charts
- Diamond
- Features of different figures of trading triangles:
- How to trade on the triangle pattern
- Trading mistakes, risks
What is a triangle in trading, application in technical analysis
The triangle trading strategy is the simplest and most profitable, but subject to the selection of a suitable asset and the fulfillment of the conditions of the strategy. The triangle is a manifestation of the struggle between buyers and sellers, the trader carefully observes and joins the strong side. When this pattern occurs, the price is clamped in a narrow range formed by two trend lines. To plot, you need 4 points – 2 highs and 2 lows, trend lines follow them. After that, you need to wait for another extremum to confirm the model. There may be 3 or 4 more extreme points, after which the price bounces inside the figure. If there are more extremums, then the figure becomes “degenerate” and has no strength. In the classical theory, the price should break through the range no later than ⅔ of the time spent in the triangle.

Types of triangles in trading – analysis on charts
There are several types of triangles, they can be converging and diverging, descending and ascending, symmetrical, converging and diverging triangle forms a diamond shape.
Descending triangle on the chart
This is a narrowing pattern, the lows are at the same level, a horizontal line can be drawn, and the highs are falling. It often occurs on a bearish trend (the price fell before the figure), but not necessarily. In most cases, it breaks down, but if it breaks up, an uptrend may begin. Falling highs speak of the strength of the bears, the buyers only have enough strength to hold the support.
If they nevertheless gather strength to set a new high, this may also indicate the emergence of a strong buyer capable of changing the balance of power.

ascending triangle
The opposite pattern, the highs are approximately at the same level, you can draw a horizontal line or a trend line at a slight angle. Each next minimum is formed at a higher level, the bears have enough strength only to contain the bulls. In most cases, it indicates the continuation of the uptrend, but if it breaks down, it can become the beginning of a strong downtrend.
Symmetrical (isosceles) triangle
A more difficult pattern to trade, compared to an ascending and descending triangle. The support and resistance lines are at an angle. Breakdown can occur in any direction. The figure speaks of the equal strength of both buyers and sellers. On a daily or weekly chart, a pattern can form over several weeks or months. The parties are accumulating strength, further movement promises to be strong. In classical technical analysis, it is recommended to trade the figure in the direction of the previous trend.

Expanding triangle on charts
The most difficult pattern to trade, the highs are rising and the lows are falling. After the next breakdown of the extremum, a reverse movement follows just as quickly, volatility grows, stops are knocked down. None of the parties has a clear advantage, it is recommended not to trade the figure, expect more clear signals. Due to the increase in volatility, it is not recommended to trade the breakout pattern. You can draw the bisector of the triangle, consider long above the line, and short below. The target will be a descending or ascending trend line. The model is more common at the top of the market, it may indicate the unsuccessful efforts of the bulls to raise quotes. When it appears, it is worth preparing for an imminent reversal. A diverging triangle is more common in the market than a converging one. The signal to exit the figure will be a breakdown of one of the lines, return after which the price may go above the bisector. In the future, the trader expects the continuation of the movement in the direction of the breakdown.

Diamond
Reversal figure, formations of a diverging and converging triangle. Occurs at the top or bottom of the market, at the moment when nervousness reaches its maximum. Uncertainty in the market leads to the formation of a diverging triangle, then the situation becomes less tense, but the uncertainty does not disappear. A diverging and converging triangle is successively formed. The figure works out quickly, after the breakdown, the price flies up or down without a rollback or retest to the target or the nearest strong level. It is better to enter on the breakdown of the edge, place a stop order at the level of 0.5-1% of the asset movement, behind the nearest level. According to the rules of technical analysis, support should become resistance and vice versa. A trader can try to wait for a retest, but in most cases there will be no retest or a false breakout and the price will sharply rush to the opposite edge. There are cases when the breakdown of the figure does not lead to a significant movement, the price passes a little and forms a new triangle. The pattern rarely forms on periods above the hourly.

Features of different figures of trading triangles:
- during the formation of the figure, the trading volume decreases;
- the pattern should form 2 clear edges. The trader should have no doubt that this is a triangle;
- during the breakdown, the trading volume increases;
- after the breakout of the figure, to determine the take profit, you need to postpone the height of the figure from the broken line.
How to trade the triangle pattern – types of triangle shapes in trading, analysis on the chart, what does the pattern mean in technical analysis: https://youtu.be/KcBALNbA84k
How to trade on the triangle pattern
Before the formation of a triangle, there must be a strong trend on the considered timeframe. As soon as a trader notices a stop in the movement and a trade, he should draw trend lines and wait. After identifying the triangle, the trader should expect a breakdown of support or resistance. Although many patterns have a preferred direction, a trader should not enter positions before a clear breakout occurs. Breakdown must occur within an interval of no more than 75% of the length of the triangle. If during this time nothing has changed, the figure is not taken into work. When looking for a suitable model, keep in mind:
- Triangles can only be traded on volatile assets. If the instrument is trading most of the time, triangles appear frequently and their breakdown does not lead to a directional movement;
- it is better to make purchases when the resistance of the ascending triangle is broken;
- it is better to sell after breaking through the support of the descending triangle;
- symmetrical patterns to trade in the direction of penetration;
- expanding triangle or skip, or go against the trend;
- the breakdown may turn out to be false, so it is recommended not to enter immediately, but to wait for a rollback and retest of the trend line. This is a more conservative option. It should be borne in mind that there may not be a rollback, then the deal will be lost. Everyone chooses the option that best suits their risk appetite;
- each subsequent movement occurs with a smaller amplitude. This should be confirmed by an oscillator – MACD, RSI or stochastic. If a divergence occurs (the lows are falling, and the peaks on the indicator are growing), one should expect an increase in quotes;
- after entering the stop position, you need to put it first, and then set the take profit. Sometimes the movements are sharp and the trader can get a big loss without even having time to enter the deal;
- in classical technical analysis, stop is recommended to be set beyond the opposite edge of the figure. In this case, there is minimal danger that the stop order will be hit, and the price will go in the opposite direction. At the same time, the risk-reward ratio is insufficient, therefore it is recommended to place a stop closer, behind the first support or resistance within the triangle. He shouldn’t be too close to be knocked down in a possible level test. You can consider the entrance in two parts. The first is “for breakdown”, and the second is after testing the level;
- if after a strong movement a very small triangle is formed, then you can try to sit longer, at least half of the previous movement. Such a figure is called a pennant. For example, the price makes an impulse movement of 1000 p, and then a triangle of 100 p is formed, most likely the price will make at least another 500 p;
- in classical technical analysis, it is believed that the price travels a distance equal to the height of the triangle, which is postponed from the breakout point. In practice, price often encounters resistance earlier, near past extremes;
- some traders do not place a take, but use a trailing stop, the order follows the market.


Trading mistakes, risks
When trading, you must adhere to strict risk management. You should not take models with little potential for work on timeframes less than an hour. There is a lot of noise on small timeframes, and after breaking through the edge of the triangle, there is no stable trend, the price reverses and knocks out the stop. It is not necessary to take into work insufficiently clear models, triangles, where there is no clear understanding of where to put the stop and where to cover the profit. Often a trader waits for a measured move in a figure, not paying attention to the fact that there are strong resistances or supports on the way. It will be a mistake to try to predict the further development of the trend without confirmation. A trader goes long on an ascending triangle pattern until resistance is broken, and when support is broken, he does not exit on a stop order.


