Pennant in trading in technical analysis – what it is, how it looks on the chart, trading strategies.
trading . Obviously, it is impossible to predict the market with perfect accuracy, but if you trade long enough, you will be able to pick up various
patterns that serve as an obvious signal of the upcoming global price movement. Head and shoulders, cup and pen, and pennants are some of the most common patterns that traders use to identify up or down price trends. So, let’s proceed to a more detailed consideration of this topic.
- What kind of pennant figure, description
- How the Pennant pattern is calculated on the chart
- The constituent elements of the pennant figure
- Pennant pattern formation in technical analysis in trading, bullish and bearish pennant, symmetrical
- Types of Pennant
- bull pennant
- bear pennant
- Difference from the flag and adjacent figures
- How is it used in technical analysis?
- Trading on the pennant exchange – practical strategies and examples with descriptions and photo explanations
- #1 Example using a standard trading strategy
- #2 Pfizer LTD Hourly Trading Example
- Pros and cons
- Mistakes and risks
- Expert opinion
What kind of pennant figure, description
A pennant is a special type of chart continuation pattern. Pennants are similar to flag chart patterns in that they have converging lines throughout the consolidation period. It represents a certain pattern of chart behavior, in which there is a significant movement in stock prices, after which the consolidation phase begins, and then the continuation of the existing trend. Pennant is a well-known pattern that is widely used in technical analysis. This figure is regularly found on the trading charts of almost all currency pairs. Attention! The formation of this chart pattern takes from one to three weeks.
How the Pennant pattern is calculated on the chart
Any chart has the highest predictive value when it exhibits certain characteristics. For continuation patterns such as flags and pennants, the presence of the pattern itself indicates a potentially larger market move in the future. For a pennant to act as a predictor of future price movement, the following market characteristics and elements of price action must be present:
- Directional price movement . The final price movement or the ability to draw a relative trend is a necessary condition for the formation of a pennant.
- Volume . Participation is a key element of an emerging market. Sustained volume during the initial price move increases confirmation of the likelihood of the trend continuing. A slight decrease in volume during the formation of the pennant can be interpreted as a good sign that market participants are not going to leave the market, but are busy looking for the optimal entry point to continue the previous trend.
- duration . Pennants are considered one of the fastest forming chart patterns. If the formation took too long in relation to the time period, then its validity is called into question.
The right time to enter the market is when the price breaks the Pennant line, which forms a triangle in the direction of its main trend relative to the flagpole.
The constituent elements of the pennant figure
Pennants have several integral elements that are present regardless of any conditions. The main elements of the figure:
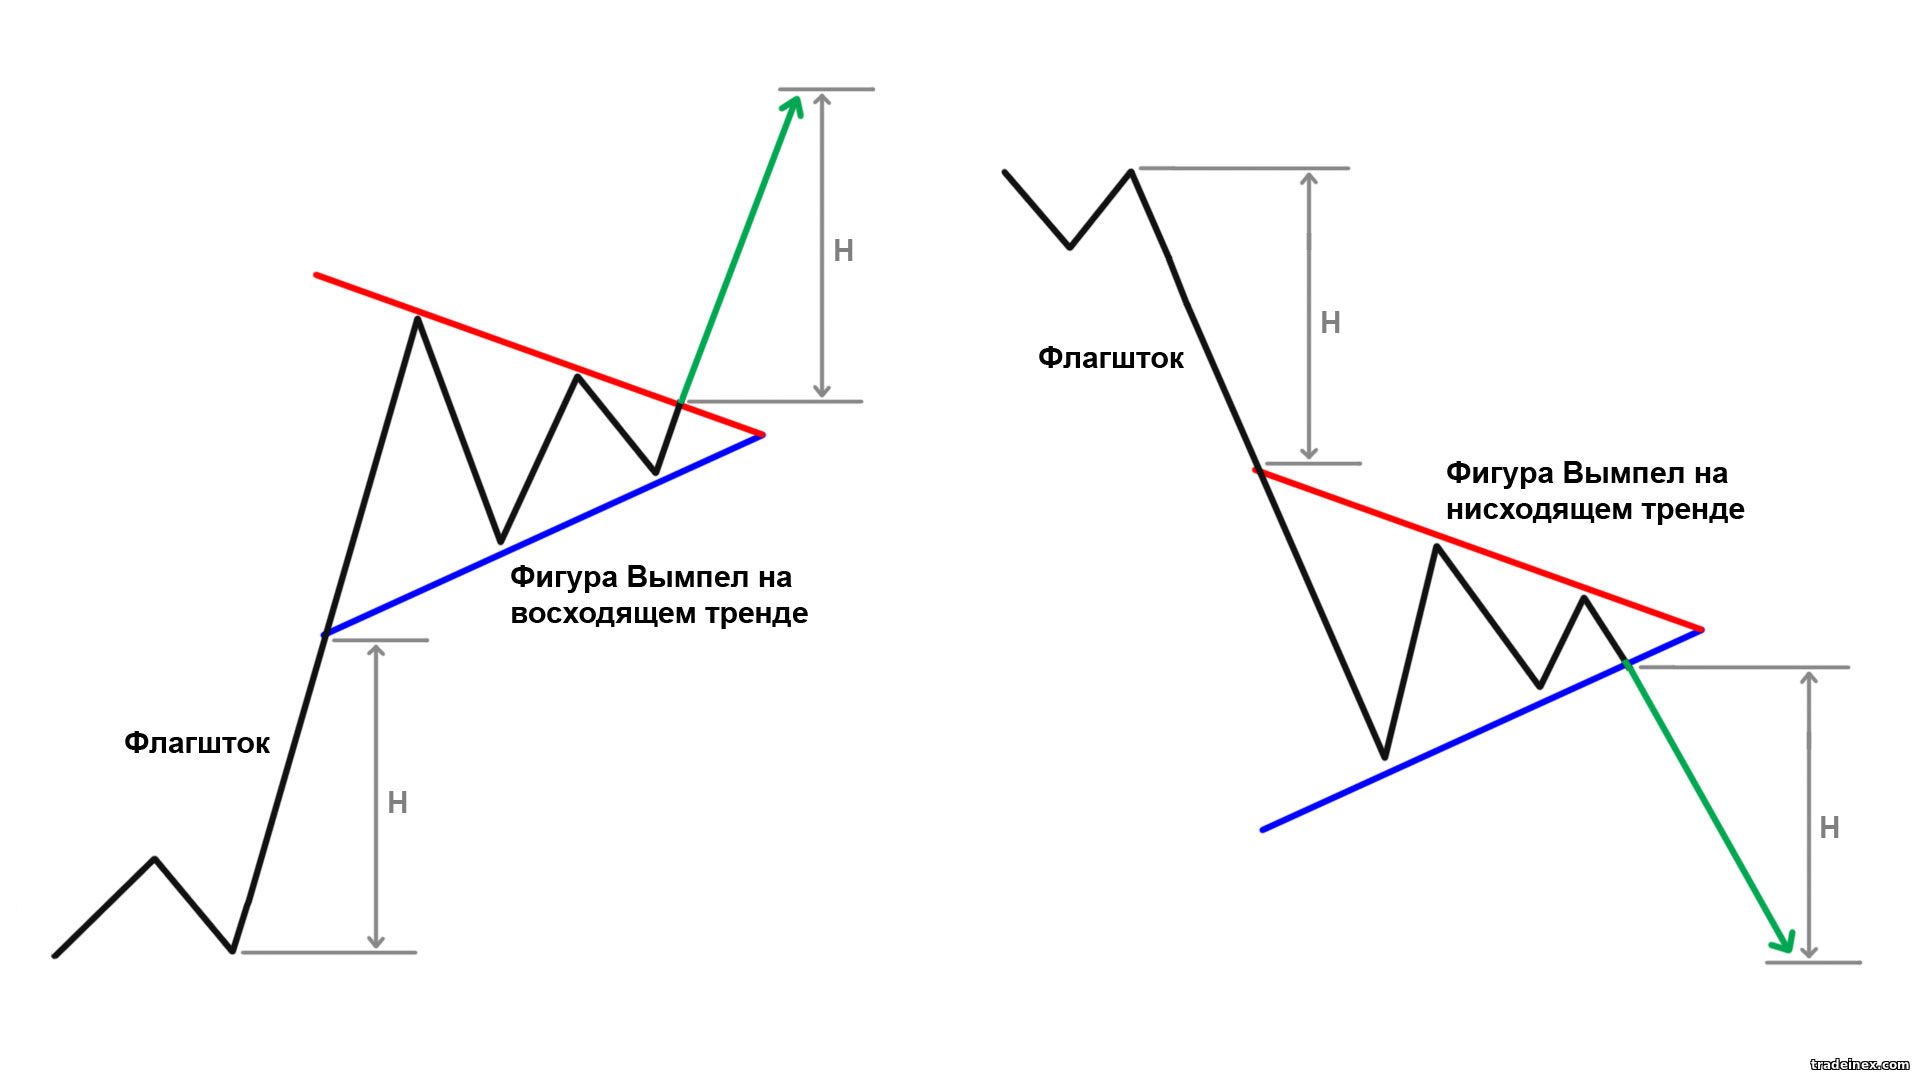
- Flagpole . Represents a trend (up or down). This is the distance from the beginning of the directed price movement to its maximum or minimum point.
- Triangle . Serves as the outline of a pennant and is built by drawing two converging trend lines (resistance and support lines); one connects the highs of the consolidation range and the other connects the lows. The two trend lines converge to form a triangle.
- Tilt . Defined by the trend lines of the triangle in relation to the flagpole. The triangle tilts against the trend and is classified as either bullish or bearish, depending on whether the initial trend is up or down.
- Rollback . It is measured by counting the top or bottom point of the flagpole from the top or bottom point of the pennant itself. Often, tools such as Fibonacci retracements are used in conjunction with pennant formations to determine the likelihood and size of a potential breakout.

Pennant pattern formation in technical analysis in trading, bullish and bearish pennant, symmetrical
The pattern on the chart begins with a flagpole in the form of a series of candles that go in the same direction. It could be a trend or simple price momentum. Further close observation of the market immediately after reaching the bottom of the bearish trend (highest point of the bullish trend) allows us to determine the formation of the final part of the pattern – a symmetrical triangle. Note that the pattern is formed relatively quickly. At that moment, when two lines passing through the highs and lows converge quite sharply towards each other, forming a small triangle, we can safely talk about the formation of the Vympel.

Types of Pennant
Pennants are of two types:
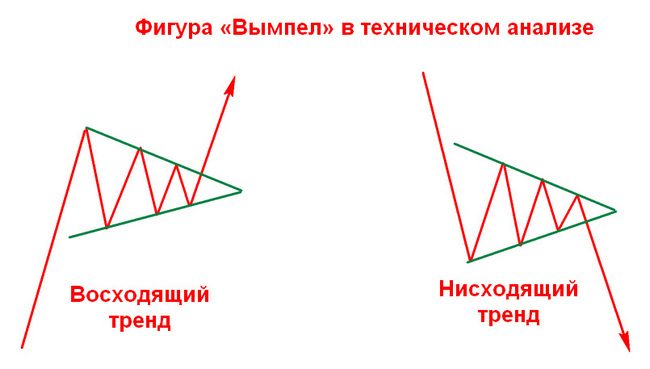
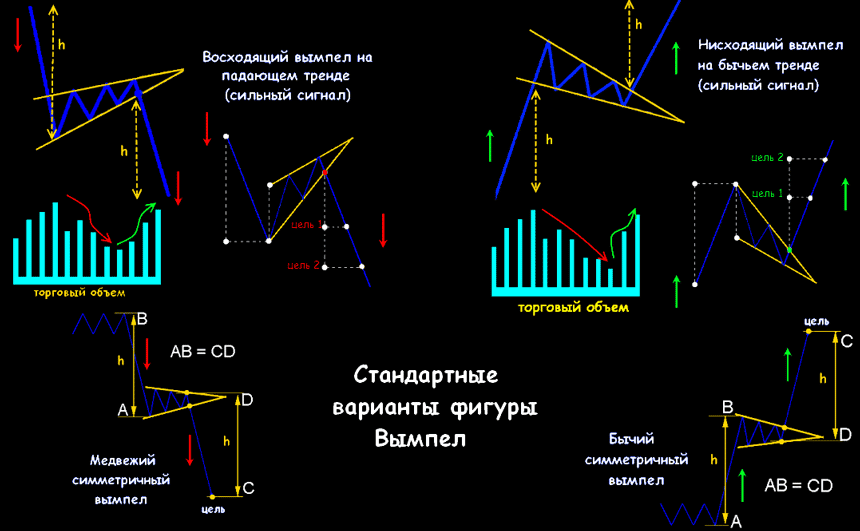
bull pennant
A bullish pattern forms after a sharp rise in stock prices. After a long uptrend, traders try to close their position, assuming a reversal will occur. Prices begin to consolidate as traders begin to exit stocks. But at the same time, when new buyers start buying the stock, it causes prices to break out in the same direction as the previous uptrend.
bear pennant
The pattern is formed after a sharp drop in stock prices. After a long downtrend, traders try to close their sell positions, assuming a reversal will occur. Prices begin to consolidate as traders begin to exit stocks. At this time, new sellers start to sell the stock, causing prices to break out in the same direction as during the previous downtrend.
Difference from the flag and adjacent figures
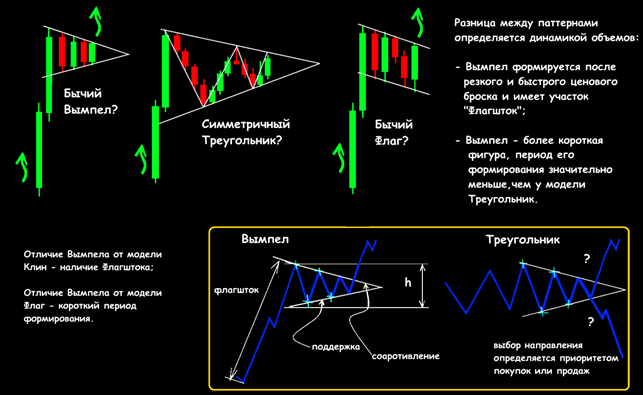
The pennant pattern is identical to the flag pattern, the only difference being that the consolidation phase of the pennant pattern is characterized by converging trendlines rather than parallel trendlines. The main difference from other adjacent figures – “Symmetrical Triangle”, “Ascending-Descending Triangle” is the scope and scale. A pennant is a small form in scope and duration, which is preceded by either a sharp price rise or a sharp fall.

How is it used in technical analysis?
When trading using a pattern, you need to consider the following points:
- After a strong move either up or down, prices should move into a consolidation phase.
- Trading volume should increase on the initial movement of this pattern formation, followed by weakening volume and then increasing volume on a breakout.
- Prices should move in the same direction after the breakout.
Trading on the pennant exchange – practical strategies and examples with descriptions and photo explanations
#1 Example using a standard trading strategy
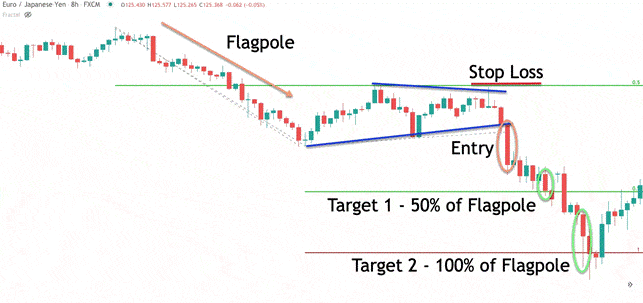
This example is a bearish version of the pennant pattern in the currency market. The chart below shows the price action of the Euro-Yen currency pair based on the 480-minute timeframe.
#2 Pfizer LTD Hourly Trading Example
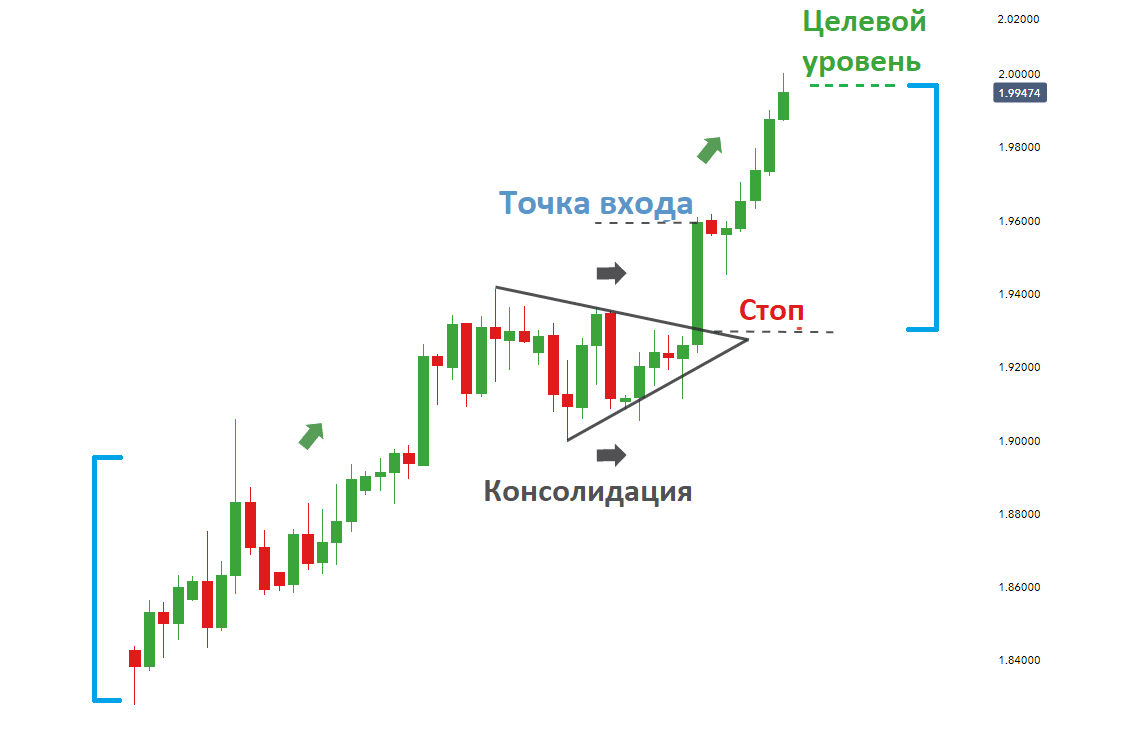
The example below shows the formation of a pattern on the hourly chart of Pfizer Ltd. After an uptrend, prices moved into a consolidation phase, forming a Pennant, and then a breakout began, followed by a continuation of the uptrend. The stop loss level is set at the lowest point of the pattern. The target price for pennants is set by measuring the initial height of the flagpole to the point where the price breaks away from the pennant.

Pros and cons
Among the advantages of this figure can be noted:
- Ideal for beginner traders as the pattern is easy to recognize.
- Corresponds to the golden rule of trading – “open only with the trend.”
- Simple formation, simple elements to remember the basics.
Among the cons:
- There is a high risk of running into a “trap” and catching a false breakdown.
- Rarely found.
Mistakes and risks
The most common mistakes among traders are the “traps” they fall into. There is a high level of false positives of the pattern, as shown in the example below:

Expert opinion
According to the “sharks” of trading, for example, Carl Icahn, Julian Robertson, pennants are easily identifiable chart patterns. Numerous studies have shown that continuation patterns are ideal for day trading. Various trading strategies using this pattern are based on the recognition of pennants, most of which have a high chance of making a profit. However, pennant formation can be tricky to recognize in real time, and larger trends and consolidation ranges require significant capital to trade properly. Ultimately, it is up to the trader to decide whether or not to include the use of pennants in the trading plan.

