
Japanese candlesticks in trading – varieties, charts and analysis of various patterns for beginners and experienced traders and how to navigate Japanese candlesticks on the stock exchange in the financial market.


- Japanese candles: what is it
- History of creation: how and where the candlestick analysis method was developed
- The main patterns of Japanese candlesticks
- Japanese candlestick reversal patterns
- Reversal pattern
- Inner Candle
- pin bar
- Pin bars at the end
- Candlestick patterns that continue the trend
- Candle Analysis Trading: Advantages and Disadvantages
- Technical graphical analysis of financial market patterns using Japanese candlesticks: how to understand charts and apply candlestick patterns in practice
- What do the different parameters of the candles mean?
- body size
- Tail length
- The ratio of the size of an element’s body to its “tail”
- Location of the candle
- Japanese candlesticks: practical analysis of the financial market
- The main types and combinations of candlesticks in Japanese candlestick analysis
- Types of candles
- Bullish candles
- Bearish candles
- Japanese candlestick combinations: basic options
- Practical application: examples
Japanese candles: what is it
Japanese candlesticks are a kind of unstable graphical curve, which was used by Eastern sellers in the Middle Ages to control price changes in rice. If we compare Japanese candlestick analysis, from the usual line chart, we can note that candlesticks show more relevant information about price changes: the opening and closing times of trading and the minimum/maximum values for a certain period of quotes. The filled rectangle between the opening and closing prices, which is the formation of these same prices for a certain period of time, is the body of the candle, and the maximum and minimum values of the interval chart for this time period are called the shadow. 
History of creation: how and where the candlestick analysis method was developed
Japanese candlesticks in the format of technical instrumental analysis were among the first to be introduced to the exchange trading market, but at the very beginning they were used and applied in few places. According to the element in the title – “Japanese” – it is easy to guess that the birthplace of the invention of candles is Japan: the Japanese, who traded rice, have been using this type of forecasting price fluctuations since the distant 18th century. It is rumored that the first graphical display of price fluctuations in the form of a sequence of “candlesticks” was invented by Homm Munehisa, who was engaged in rice trading. The method was developed for clarity – what are the minimum and maximum values reached by the price for a certain time, and also what is its value at the time of the beginning and end of sales. But due to the fact that at that time Japan was removed and closed from most of the world, the candlestick charting system in Europe and the United States was discovered later, when trading was gaining momentum with might and main. Today, a large number of experienced specialists and traders recognize that such a graphical display of price parameters is most practical for stock trading – candles clearly indicate not only where the price is moving, but also the prospects for participants in a certain period of time.

The main patterns of Japanese candlesticks
Each individual element from the candlestick analysis system provides the trader with certain data. For example, a short shadow of a candle indicates that trading on the shadows of candles was on the verge of the opening or closing price, and participants in exchange trading showed rather low activity throughout the entire period of sales. That is, bulls (buyers) dominated the sales market – they controlled the price, raising it to maximum values. But experts note that the most effective and powerful signals are given by candlestick patterns. Candlestick patterns are separate patterns that can include one or more candlesticks. These models are categorized as:
- the first one speaks about the possibility of developing a trend for a particular product and is called a reversal pattern ;
- and the second indicates its continuation in the near future and is a trend continuation model .
Let’s take a closer look at these two groups. 
Japanese candlestick reversal patterns
Reversal pattern
A reversal pattern is a candlestick pattern characterized by a change in the direction of the price graphic curve after the formation of candlestick elements. The most sought after candlestick reversal patterns such as bullish and bearish engulfing, as well as inside bars and pin bars, such as pinocchio and doji.

Note. Considering the circumstances described above, the extreme element of the price line should be larger in size than the previous one: the body of the last candle should completely “eat up” the body in front of the standing element, and the shadows should cover the full silhouette of the penultimate candle. In practical application, this will mean that the current trend movement is losing strength (this is indicated by an extreme candle, characterized by small sizes, formed in the direction of the asset).
At the same time, the extreme bar, having determined the opposite direction, indicates that the participants in the exchange trade express sufficient interest in another trend, have the strength and ability to further raise the price. Thus, if on the next bar the price line starts moving in the direction chosen by the this side can and should make a deal. https://youtu.be/4JK_S2HqD1w
Inner Candle
The next popular and promoted reversal pattern is the inside candlestick. Graphically, this pattern is displayed in the opposite form to engulfing: the pattern also includes a couple of bars, but the last candlestick is completely covered by the shadow in front of it.

Important! If the price can break in the direction indicated by the internal pattern, you can make a deal. If this is not done, the model will be counted as not formed and the signal will be missed.
pin bar
The third no less famous and popular candlestick pattern is the pin bar. This sample got its name from the fairy-tale hero Pinocchio, whom everyone remembers as the owner of a long nose. This characteristic was transferred along with the name to the candle, which has the same long shadow.

Interesting! The bullish pin bar is also called the “Hammer” because the shape corresponds to it: the model has a long shadow directed down and a small white body. Unlike the Hammer, the bearish pin bar and doji have a long up-shadow and a small black body.
Pin bars at the end
The last type of reversal candle is pin bars at the end of a trend. They provide the exchange trading participant with information that the group of participants that dominated the exchange in the last period made the last attempt to continue the trend, but the forces were not enough and the price began to move in the opposite direction (this is indicated by a long projection silhouette).
Note! After the formation of such a candle, it is worth making deals in the direction opposite to that indicated by the long shadow projection, namely, opposite to the current trend.
Candlestick patterns that continue the trend
Patterns that continue the trend are less in demand among traders in the exchange market than reversal patterns, as exchange traders try to catch trends at the very beginning. However, this tool can still be used for its intended purpose – it warns the seller that going against the trend at the moment would not be the best idea. Let’s consider several models. The most popular and effective model of three candlestick elements – it works the same for both situations in the market, whether it’s moving up or down. It is easy to guess that the model includes three candles, small in size, which follow in numerical order against the main current trend in the market. The last candle is a large bar that follows the direction of the previous trend, which goes against the three elements ahead.

Candle Analysis Trading: Advantages and Disadvantages
Technical analysis of financial markets through Japanese candlesticks is valued among traders due to its practicality. Candlesticks are not an information system or device, they are a type of chart on which the price curve indicates stock changes. However, despite its versatility, in order to understand the meaning of the chart and recognize movements and changes in time, to be able to put candles, you need to have some experience. Like most automated trading strategies, exchange trading using candlestick instruments will not be clear to every beginner.
Important! You do not need to immediately start trading on candlestick patterns for real money, there is a high risk of burnout.
In addition, really high-quality and understandable candlestick patterns are hard to find and form. As a result, most often a participant in exchange trading remains unclear: to open a deal at an ambiguous sign, risking burnout, or to wait for a perfectly built and clear sample, without opening a deal for a long time, and consequently, remaining without income.
Technical graphical analysis of financial market patterns using Japanese candlesticks: how to understand charts and apply candlestick patterns in practice
Participants in exchange trading perceive the movement of the price line on the exchange as some kind of competition between traders and clients.

- If the number of customers in comparison with the number of sellers in the financial market is overwhelming, or the buying interest is higher, the price rises. It increases until it reaches the maximum, when the sellers again consider it interesting for further movement.
- If traders dominate the financial market, the equilibrium price will decrease until the balance is established and the number of buyers in the market increases.
- If any side (sellers or buyers) outweighs the number of players by several times, the market will pick up speed and move in the same direction.
- When the interests of merchants and customers coincide, the equilibrium price also remains stable. Both sides of the players have no complaints about the current price, so the financial market is in balance.
What do the different parameters of the candles mean?
Every technical analysis, using any tool, is done to compare the strengths of both sides and assess who currently dominates the financial market. In addition, price analysis allows you to find out in which direction and with what speed the equilibrium price will move further. The shade of the candle element tells the trader who dominates the market – sellers or buyers.


Pay attention! It is not necessary to memorize all candle elements, it is important to understand what exactly they consist of. That is:
- body size;
- tail length;
- the ratio of the size of the element’s body to its “tail”;
- candle location.
Let’s deal with each structural part of Japanese candlesticks separately. Japanese candlesticks for beginners, how to conduct a graphical analysis of financial markets based on patterns and combinations: https://youtu.be/TqnbdtgD2Oo
body size
The value of the candle element indicates to the trader the difference between the opening and closing prices, shows the ambitions of bulls and bears.
- a long body of an element, which entails a rapid increase in the equilibrium price, indicates an increase in client interest and a strong price movement;
- if the size of the body increases progressively, this means that the price movement along the trend is also accelerating;
- when the body of the candle decreases, this indicates that the current trend is ending due to the equal interests of bulls and bears;
- if the bodies of candlestick elements remain motionless, then this confirms the continuation of the current trend;
- If the exchange unexpectedly changes positions from long rising bars to falling ones, it follows that a sharp change in trend is coming, the dominance of sellers has changed in the market, now bears control the price.

Tail length
The length of the “tail” (candle shadows) makes it possible to recognize the range of fluctuations in the price line. What does shadow length mean?
- long ones indicate uncertainty, that is, bulls and bears are currently actively competing, but so far it is impossible to conclude who will take control of the price;
- short ones indicate stability in the financial market with slight price fluctuations.
The size of the “tail” often increases after a period of an uptrend. This means that the competition between bulls and bears is gaining momentum at the moment. Adequate trend, which moves in one direction at a high speed, usually shows candlestick elements with short “tails”, since one of the parties of the players constantly controls the price.
The ratio of the size of an element’s body to its “tail”
It must be taken into account that:
- During the mainstream, the body of the candlestick element is longer than the tails. The stronger the trend, the faster the price moves in the chosen direction.
- When the trend slows down due to an imbalance in the sides of the players, the ratio of bulls and bears changes accordingly, becomes uneven, and the “tails” lengthen compared to the bodies.
- There are practically no tails in the ascending position, which indicates a strong trend. Long tails are seen in a period of consolidation, which is determined by the ambiguity and increased competition between bulls and bears. In some cases, an increase in the shadow of a candlestick element heralds the end of a trend.

Location of the candle
- If a trader sees only one dominant candlestick shadow on one side, and the body of the element is located completely on the other side, this scenario will be called a pin bar. The “tail” indicates that the price line wanted to start moving in a certain direction, but the other side of the exchange strongly pushed the price in the opposite direction to the expectations of the other part of the players.
- Another standard scheme indicates a candle element with a pair of shadows of the same length on both sides and a relatively short body. This scenario is called doji. This pattern primarily indicates ambiguity, but can also indicate a balance between bulls and bears. Customers tried to increase the equilibrium price, while sellers, on the contrary, tried to decrease it. But as a result, the price line returned to its original position.
How to read Japanese candlesticks, “Japanese trading” on charts: https://youtu.be/8MVH9VumsxE
Japanese candlesticks: practical analysis of the financial market
Now that we have analyzed all the above factors and found out how they work, what they consist of and how they function in practice, we can put all this knowledge together and see how to use the knowledge gained about Japanese candlestick analysis in practice, namely in charts:
- During a downtrend, candlestick elements are only bearish with long bodies and short “tails” or with their complete absence – this indicates the superior strength of traders.
- Referring to the image below, we see a kind of price rebound. This is not enough to turn the price in the opposite direction, but then we see the strongest elements from the sellers.
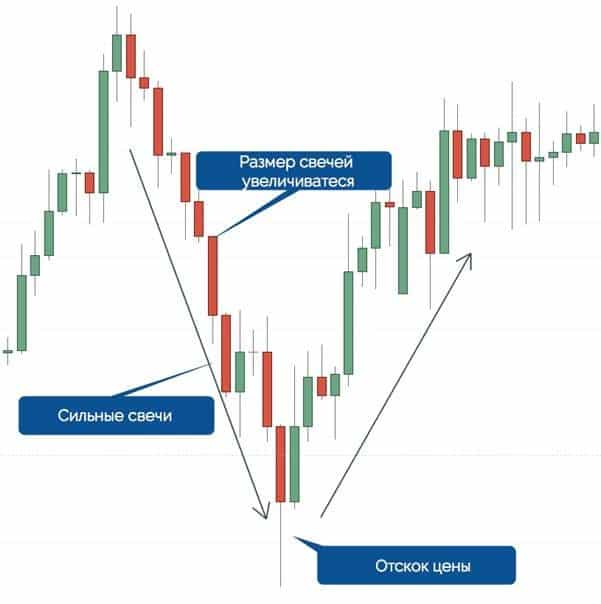
- The trend can move only on some strong candles from buyers, without the pressure of bullish elements.
- After that, the body of the candle decreases, and the “tail” increases, indicating that the strength of the momentum is also weakening.
- The price returns to its original position, which is now resistance, and a silhouette of a small bounce candlestick appears in front of the trader.
- At the support level, an exchange trader observes a decrease in candles and an increase in the number of shadows, which is a direct confirmation of fluctuations in the financial market. This situation also reduces the risk of a breakdown of this level.
- Before reaching and stepping over the support level, the price only begins its formation into a buying element pattern, hence the momentum arises.
- During an uptrend, bars have a long body and have short, insignificant “tails”.
- Further, a participant in exchange trading may notice a pair of long shadows at the bottom of the chart. They indicate that the price was trying to go down, but the pressure from the bulls was not enough for a full-fledged action.
- Candles shrink even further when the attempt to lower the price fails, indicating that the trend is coming to an end.
- Further, the trader may notice that a strong candle from the side of buyers now dominates, which indicates that a new trend is starting to emerge at the current moment.


The main types and combinations of candlesticks in Japanese candlestick analysis
So, let’s start with the fact that all Japanese candlestick elements at the beginning look neutral – in the form of a line. The line is a new bar, which at the very beginning is in a neutral position. Participants in exchange trading cannot predict what element will be in the future, because it only has to move up or down the chart.


Types of candles
We figured out that two types of candlestick elements are dominant in the financial market – bullish and bearish. Let’s consider them in more detail.
Bullish candles
Bullish candles indicate that there is strong client pressure in the financial market at the moment. As long as the number of customers exceeds the number of sellers, the elements will be bullish. If the buyers lower the pressure and the sellers, on the contrary, step up, the participants in the exchange trade will notice that the number of bullish candles will be significantly reduced. This indicates a weakening of one of the sides of the players, namely, the clients. If the body of the candle is large, this is a powerful bullish bar, if the body is small, then the bullish element is weak. The bar not only indicates the price set in the market at the moment – it also says that now the bulls are in control and the clients on the exchange are the vast majority. This data is important in stock trading.

Bearish candles
A bearish candle, opposite to a bullish one, says that the financial market is now dominated by sellers. As long as they are in the vast majority, the elements will be bearish. If the sellers loosen their grip and the buyers increase the pressure, we will notice that the number of bearish bars will decrease. This situation indicates a weakening of the strength of sellers.

Note! If the financial market is dominated by the number of traders, then opening long candles will not be the best option.
Japanese candlestick combinations: basic options
There are a lot of combinations in candlestick analysis, it’s hard to sort them all out. A participant in exchange trading over time gains a certain amount of experience, which allows him to understand which models are best combined with what, so that the option is successful and effective. And we will consider only a few basic options. One of the most popular and effective is the hammer and its reverse combination is the inverted hammer. This bar has a large long tail pointing up and a small body pointing down. Appears at the bottom of a downtrend.


harami ” means pregnant, so if you carefully examine the chart, you will notice that the body of the right element is graphically located inside the body of the left bar.

Practical application: examples
The pictures show illustrative examples of the use of certain candles.
Pin Bar

Absorption


