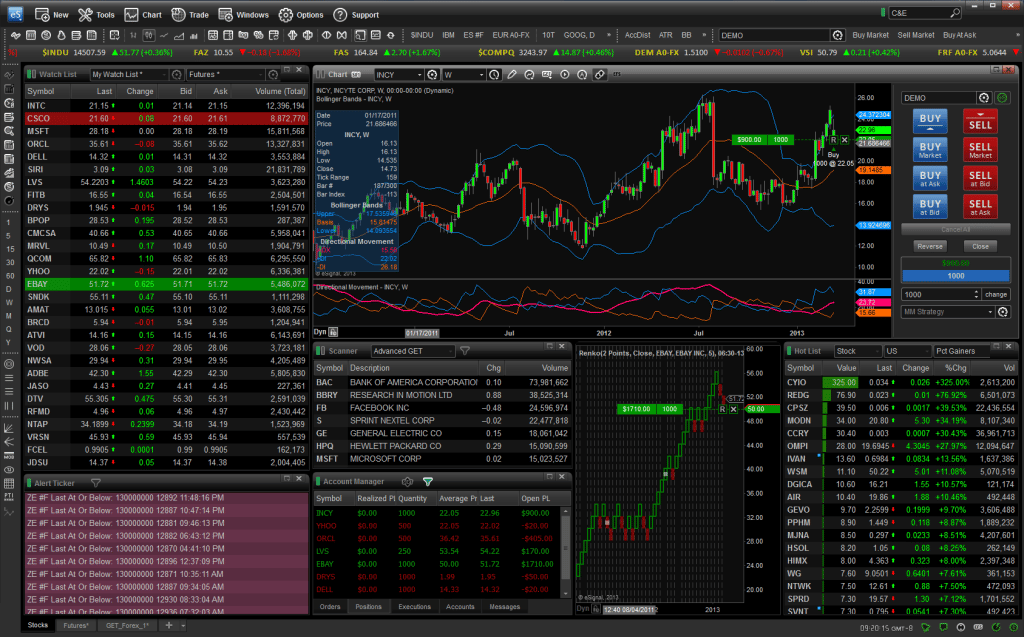
Description of the eSignal trading and investment platform, features, how to download and configure, interface features. eSignal is a trading platform that includes all the necessary functionality with tools for technical analysis and professional trading. Official site https://www.esignal.com/. To ensure comfort in work, the trader is provided with modules for testing strategies, charts, quotes, and various indicators. Reports on actions already taken can also be displayed. 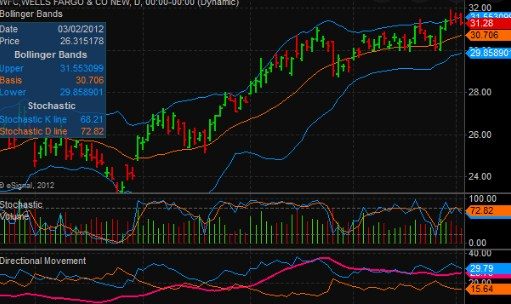
leading exchanges around the world– it is possible to fully integrate with the broker. It is all these facts that make the trading platform an exceptional choice, characterized by a complete combination of price and quality.
- Composite tools and capabilities of eSignal
- Advantages and disadvantages of the platform
- Software download – how to download and install the eSignal platform
- Using eSignal for trading – an overview of the functionality and interface, charts, quotes
- Quote windows in eSignal
- Market Information
- Ticker
- Other types of windows
- Graphs
- Extended chart
- Scanning markets
- Detailed description of platform features
- Plot windows
- New chart
- Insert symbol
- Insert spacing
- Time patterns
- Name
- Data range
- Sessions
- Graph type
- Drawing tools
- Applying drawing tools
- Templates in eSignal
- Line Tool Alerts
- One time per bar
- Warning action
- trend lines
- Trendline Properties
- String formatting
- Price line
- Managing drawing tools
- Market Information
- Symbol
- DOM Mode, Info and Ticker
- DOM Mode (Market Information)
Composite tools and capabilities of eSignal
eSignal includes the EFC language script – EsignalFormulaScript, which allows you to develop your own strategies and indicators. And with the help of the FormulaWizard function, everything is done quickly and easily. A huge number of graphs are supported, differing in appearance. For work, it is possible to use more than a hundred indicators and various drawing tools that can be changed / added using a language script.
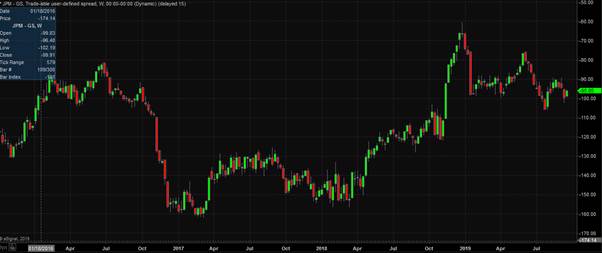
In addition to all of the above, eSignal has a special platform for professional option analysis – OptionPlus. It is used in searches and subsequent tracking of positions. This additional platform has 2D/3D charts as well as what-if scripts.
Tariffs (price) on the eSignal platform in 2022:

Advantages and disadvantages of the platform
The eSignal platform is able to offer traders a wide range of opportunities, such as writing strategies and indicators using a scripting language. Thanks to the EsignalFormulaScript option, each user can develop strategies without paying attention to complexity. Moreover, it is possible to create individual analysis techniques without exceptional knowledge and skills. And with the use of FormulaWizard, this process can be doubled. Of the significant advantages of eSignal, the following aspects stand out:
- the ability to individualize charts and choose the size of the candles yourself;
- a wide range of items for adding graphic elements, for example: the ability to draw price channels, or trend levels;
- simulation of any portfolios and verification of their effectiveness;
- smooth resizing of the graph, built-in scaling;
- use of unique plug-ins, drawing up partnership agreements with brokerage companies;
- various archives and libraries of tools, indicators;
- the ability to work with any mobile devices.
You can download eSignal to work on mobile devices at https://www.esignal.com/members/support/esignal-mobile:
Software download – how to download and install the eSignal platform
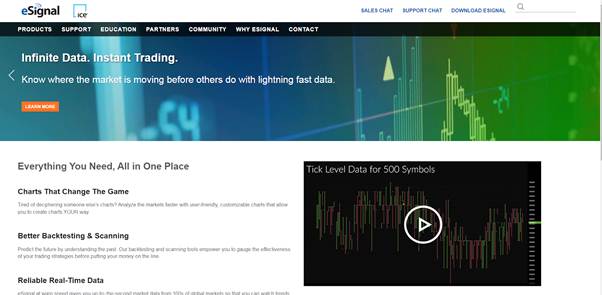
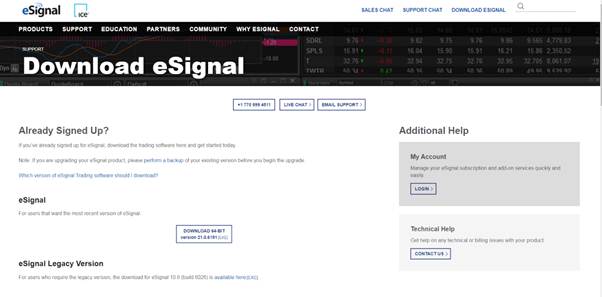
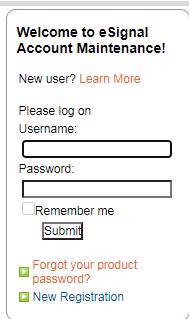
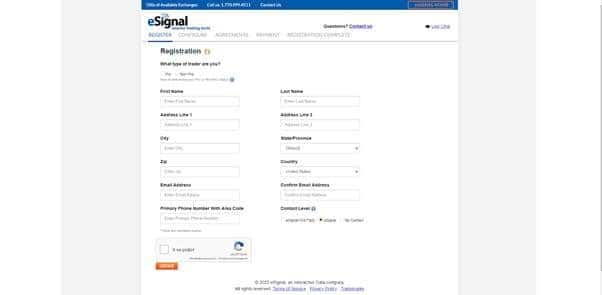
In order to download the program and start using it, you will need to register in your Personal Account. You need to go to the eSignal official website: https://www.esignal.com/index, and then click on the “DOWNLOAD ESIGNAL” button in the upper left corner:
- The first package called “Classic” will cost $58 (4361 rubles) per month – this plan is good for beginners, contains intraday stock quotes, unique charting tools, a market scanner for 1 exchange, and a 200 character limit .
- The second package is “Signature” . Its cost is $192 (14436 rubles), and the annual subscription will have a 25% discount. It is this plan that is considered the most common among traders, suitable for advanced users. The list of features is wider – charts with tools that can be customized, real-time stock quotes, smartphone applications, a market scanner for three exchanges, and a 500-character limit.
- The richest plan in terms of functionality is “Elite” , its monthly subscription is $391 (29,400 rubles). The annual purchase is issued with a 20% discount. The price component of this package includes the following options: access to weekly webinars, rich charts, a market scanner for 3 exchanges, mobile trading applications , ready-made strategies and research, as well as a 500 character limit.
Before you download the program and start using it, you should check the system requirements to check eSignal’s compatibility with your computer’s specifications. To download the program, follow these steps:
- On the download page, click on the “Download” button.
- Select “Open” when finished.
- A dialog box will open where the installation is being carried out – you must confirm the download and wait for the installation to complete.
Now, you just need to run the program from the desktop. eSignal Software: How to Setup Charts In Their Platform: https://youtu.be/BJYU4PbZvIs
Using eSignal for trading – an overview of the functionality and interface, charts, quotes
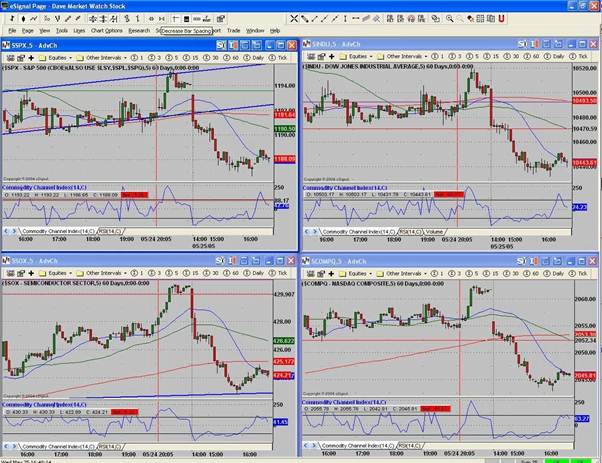
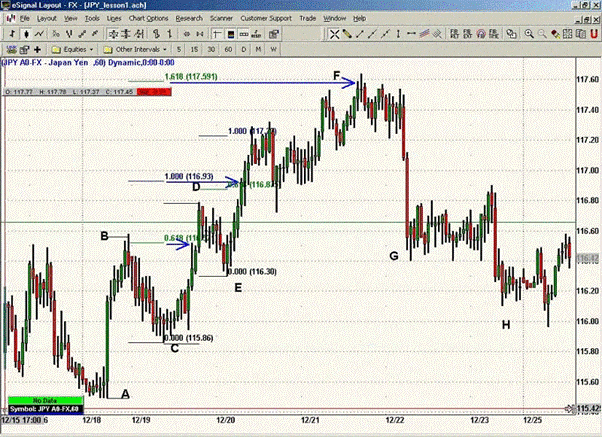
When the program is launched for the first time, a welcome page will appear by default. The user can open other examples from the “Menu Pages” item, or create their own. The workspace management plan provides two options. The first one is “Page”, all the others are called “Layouts”.
“Pages” can store the position of each window, as well as those windows that are located in the same paging file. When creating the first page, the user needs to select a series – “Types of windows”. After, when everything is set to the desired characters, settings – the user simply saves the entire screen as a page. “Layouts” is a collection of exceptional windows – they are all named and stored in a unique order.
Quote windows in eSignal
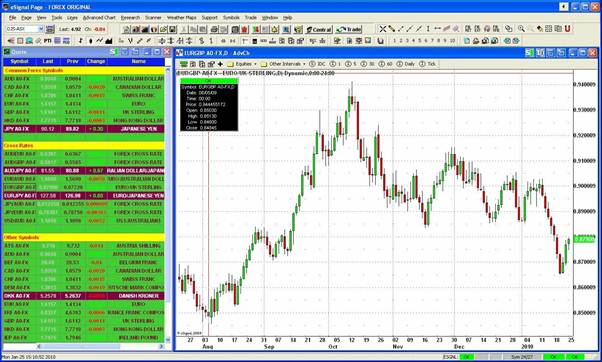
Quote windows display information in a spreadsheet. Questions can be asked in the quotation window, they depend on the services to which the user is subscribed. Next, you need to customize the “Quota” windows with more than 50 areas.
Market Information
All data is displayed in the main part of the window – each quote includes a market maker ID (MMID) and time. Additional characteristics are displayed depending on the option selected for the window.
Ticker
There are 4 types of line in eSignal – “Quotes”, “News”, “Limit Alerts” and “Market Maker Activity Ticker”.
Other types of windows
In eSignal, the user has the opportunity to use other types to improve their own skills – windows that can be included: portfolio window, general window, bulletin board, leaderboard window, details window and built-in scanner window. In addition, the toolbar is able to provide quick access to many key features of this platform.
Graphs
Extended chart
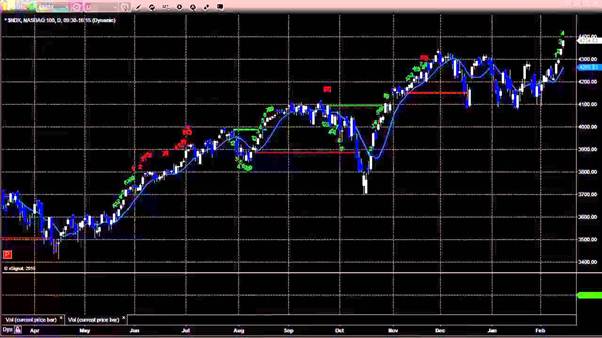
Of the features of this graph, one can note: customizable scaling and a wider range of use of drawing tools. Advanced Chart can offer a flexible interface that includes a complete set of analytics tools.

To use all the above settings, you need to right-click in any area of the chart, and then select any item from the pop-up window.
eSignal Software: How to set up charts on your platform: https://youtu.be/BJYU4PbZvIs
Scanning markets
The eSignal platform offers several scanner add-ons to choose from – all of them use a wide database that exceeds 10,000 US stocks with real-time market searches. In addition, the results scanner can also be enabled in the quotes window, while the list will continue to be updated without delay.
Detailed description of platform features
Plot windows
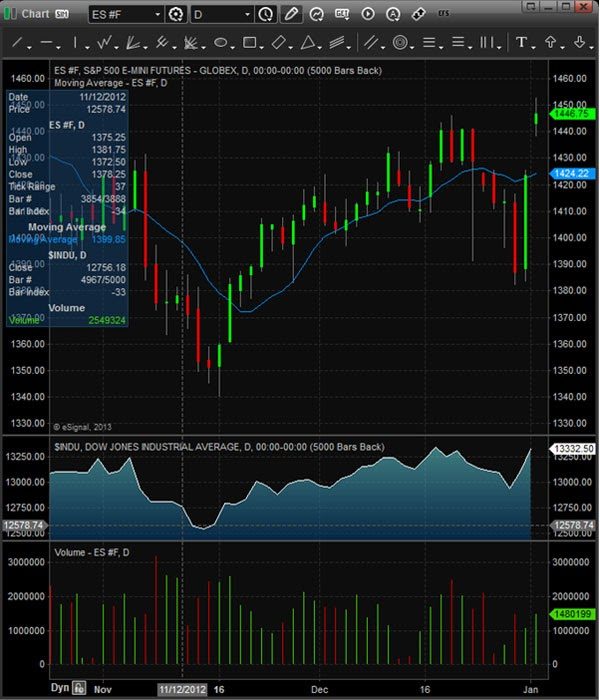
One of the key features of the graph windows is that many of the features are clickable – you can drag and drop studies to overlay or reorder them; or by double-clicking the mouse, you can edit the selected object.
New chart
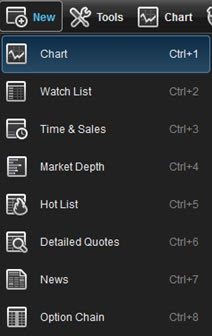
To open a new chart, you must click the “Create” button in the main menu, then select “Chart”.
Insert symbol
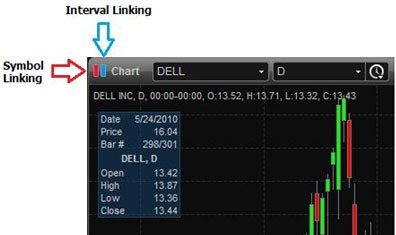
To enter a symbol in a diagram window, you must ensure that the diagram is the active window, then you can enter the first letter of the symbol. The symbol will automatically fill in the field located in the upper left corner of the chart window. You can also right-click on the chart and select “Insert Symbol”.
Insert spacing
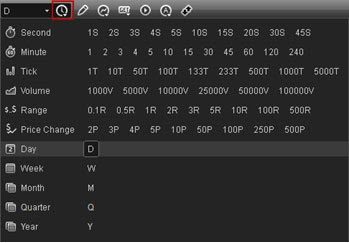
There are 2 ways to enter a chart interval: the interval can be changed by entering a number, (i.e. 5 if it will be a five-minute chart) or by entering a comma (,) to enter non-minute intervals such as
D (Daily),
W (Weekly ),
M (Monthly),
Q (Quarter),
Y (Year), etc. The second is to click on the icon located next to the interval field. Selecting the spacing icon will display a variety of default spacings to choose from:
Time patterns
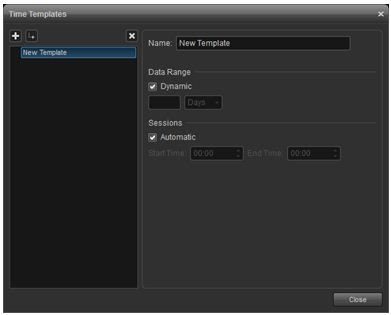
Allows the user to set the start and end times displayed in the graph window. They can also be used to specify the number of days or bars to display. You need to right-click in the chart window, go to “Time Patterns”, then click “Format” to create a time pattern. The window below will appear:
Name
Enter a name for the new template in the field.
Data range
Used to request the range of data to be loaded onto the chart. With this function, you can preload a given amount of data. By default, the “Dynamic” checkbox is selected. If you use a static view, then you need to uncheck the box. In addition, you can choose to load a specified number of days or bars using the drop-down menu.
Sessions
Start and end times are automatically set, depending on when the exchanges open and close. You can set the time manually, while disabling automatic checking. After entering the changes, you must click – “Close”.
Graph type
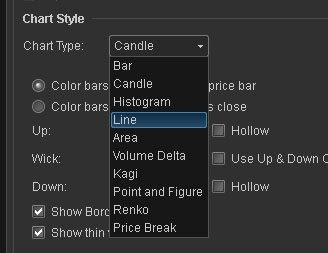
In the “Edit Chart” menu, you can select one of the chart types, including histogram, area, and line charts – the following chart types are also available in this menu:
Drawing tools
Applying drawing tools
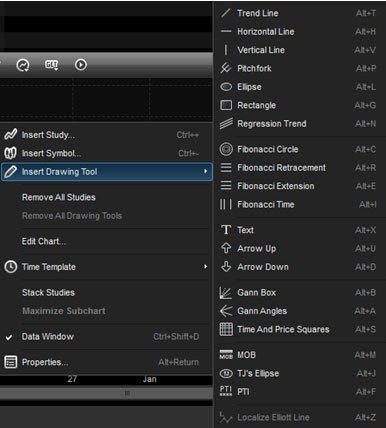
Trendlines, text, and
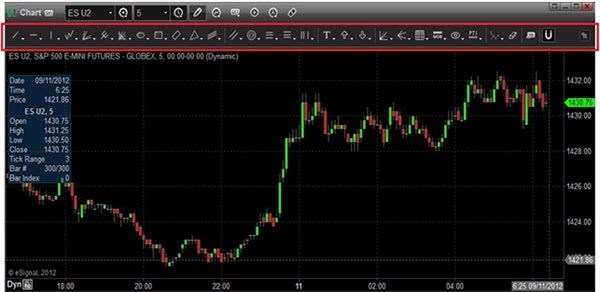
Fibonacci tools are available through the Drawing Tools toolbar. You must click on the “Pin” button on the toolbar on the chart so that it is permanently displayed.
Templates in eSignal
Allows you to create multiple versions of a drawing tool that are applied instead of having to edit the tool each time. To create a template, set new options in the Edit Graph dialog box, then click the Template button at the bottom of the window. After all of the above, you should save and give the template a name – “Save as ..”.

To apply a template, you need to right-click on the drawing tool icon that is applied to the graph.
The example created several templates for the Regression Trend Draw tool. By right-clicking on an instrument, you can choose which version you want to use on the chart.

Line Tool Alerts
It is possible to set an alert based on the price levels displayed by any line tool on the drawing toolbar. When using an ellipse, a rectangle, and a Fibonacci circle, a warning is generated by the shape’s boundary line. Thus, you can receive notifications when the price is near support or resistance levels, along the lines or along the border of the pattern. To set it, you need to right-click on the chart and select “Change chart”, click on the “Line” tool, for which an alert will be set. In the example below, selecting “Trendline” which is on the left side of the window will also display the “Properties” and “Alerts” tabs.

S&P 500 e-mini, it is 0.25. This means that if the minimum tick is set to 4, then the alert will be triggered when the price drops within close proximity to the alert price. (0.04 for stocks and 1.0 for S&P 500 e-mini)

Automatic Reactivation The alert is activated every time it is triggered.
One time per bar
The alert is activated once per bar, regardless of whether the price hits the bar settings.
Warning action
Here you can choose how the alert is shown when it is triggered, and then add a comment.
trend lines
There are many options in selecting trendline types by right-clicking on the icon. The following menu will then appear:
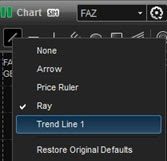
Trendline Properties
If you right-click on a trend line and select “Edit”, a dialog box for the trend line will appear.


String formatting
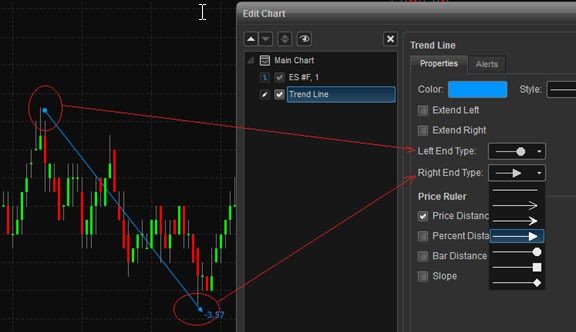
In this section of the dialog box, you can change the color, style, and width using the various menus to format the string. Unchecking “Expand Left” and “Expand Right” allows you to use the trendline segment. There is also a choice of the type of ends from the list – for one end or both ends of the string.
Price line
The second section of the dialog box is for setting the trend line as the price line. It is possible to measure the distance, or slope, between two reference points. In addition, percentage values can be shown to track performance – you need to check the boxes for “Price distance”, “Percentage distance”, “Bar distance” and slope for the displayed products (if any).

Managing drawing tools
This feature allows you to keep track of existing lines and drawing tools. You should right-click on the chart, and then select “Manage Drawing Tools”:

A list of columns will be found that can be sorted by the following characteristics: by symbol, type, start/end time of binding, start/end price, and last modified.
In the upper left corner, you can choose to display all symbols, the current symbol, or all symbols except the current ones.

Market Information
The Market Info window displays the best prices and offers by market maker in descending order. The window is used to assess supply and demand to potentially identify buying and selling opportunities. To open the window you need to select “Create” in the main menu, and then “Market Information”. A keyboard shortcut is also available (Control +4).

Symbol
Enter a character in the title bar, then press “Enter”:

DOM Mode, Info and Ticker
DOM mode is designed to display information, ticker or net order imbalance.

DOM Mode (Market Information)
This function will split the Bid/Ask data field vertically, displaying request data on top and bid data on the bottom of the split:

