Rectangle in trading – what it is, how it looks on the chart, trading strategies. The trading rectangle is one of the most famous and popular figures. Traders trading in various markets are guided by it. Seeing a rectangle pattern on the chart, a trader can understand that at the moment the bidders are indecisive, but sooner or later this period will end and the trend will continue its movement in the given direction.
- How to calculate a rectangle shape on a chart – the correct interpretation
- The constituent elements of the figure “rectangle”
- Types of “rectangle”
- bullish pattern
- Bearish pattern
- How to use the rectangle pattern in technical analysis for traders
- Pros and cons of the pattern
- Mistakes and risks
- Expert opinion
How to calculate a rectangle shape on a chart – the correct interpretation
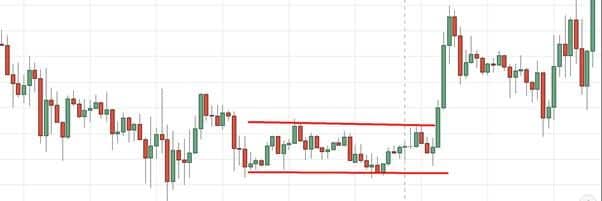
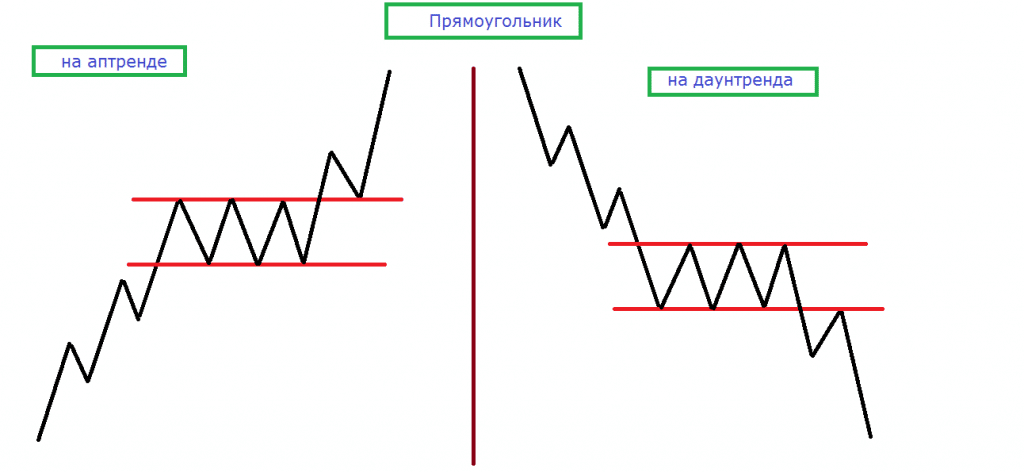
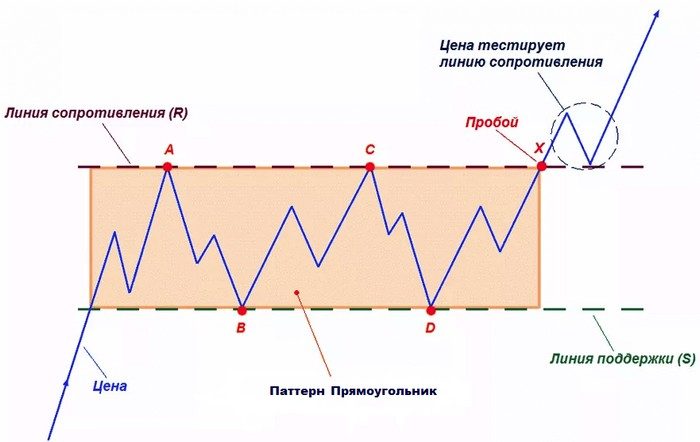
It is quite easy to interpret a rectangle on a chart. It looks like a side corridor consolidating the price chart and limited by support and resistance levels. Usually the pattern begins with the price hitting a resistance level if the trend is up or a support level if it is down. Then the price rolls back to the opposite level. After that, the price finds itself in a channel between two levels and moves in it until it finally breaks through one of them. Until the moment when the price breaks through the level and the next candle closes outside the channel, it is impossible to talk about the completion of the pattern. At the same time, the narrower the rectangle, the more momentum the price breaks through the level. https://articles.opexflow.com/analysis-methods-and-tools/svechnye-formacii-v-trajdinge.htm By the way, not always a rectangle acts as an independent figure. Very often it is a component of another well-known pattern –
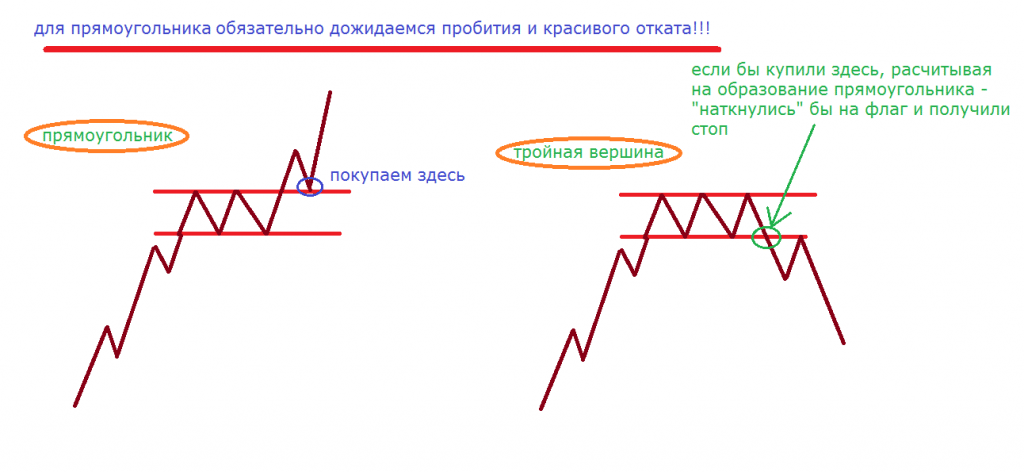
flag . The flag can be identified by the fact that the rectangle is preceded by a long upward or downward momentum, reaching a support or resistance level (depending on the trend). In the future, the price consolidates between levels and fluctuates until the breakdown, which, as a rule, continues the trend set by the initial impulse.
The constituent elements of the figure “rectangle”
A trading rectangle consists of “peaks” and “falls”. There should not be less than three of them, although some analysts begin to consider the rectangle pattern in trading as such after two bounces. The maximum number of such points is not limited in any way. However, experienced traders know that there will not be very many of them. Usually the price touches the limit lines several times, and then breaks them. What about volumes? It can be seen that as the rectangle forms, the volumes gradually decrease, by the time the pattern is completed, the volume may even reach a minimum.
A breakdown is usually accompanied by a sharp increase in volumes. If the breakdown occurred, but the volumes did not grow, there is a high chance that the breakdown was false. However, it is not worth focusing only on volumes when calculating a true or false breakout. It often happens that a successful breakdown is not accompanied by significant changes in volumes, so it is better to focus on several indicators at once.
Types of “rectangle”
Depending on the uptrend or downtrend, the rectangle can be bullish or bearish, respectively.
bullish pattern
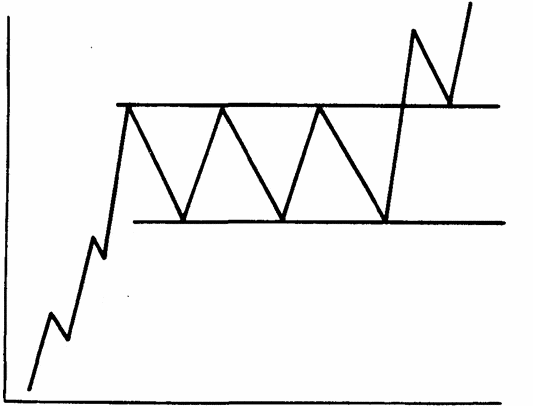
A bullish rectangle in trading is formed during a downtrend. In this case, bullish traders tend to go long in order to close the position after the resistance line is broken.
Bearish pattern
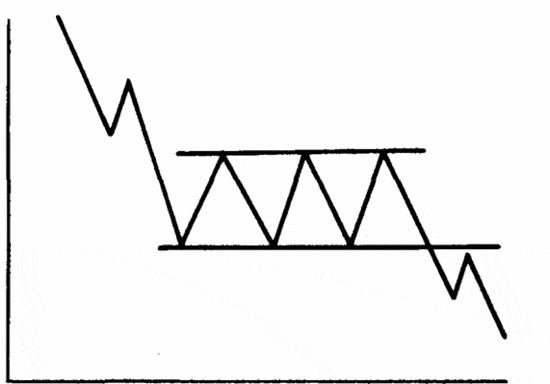
In this situation, the opposite is true, traders who take a bearish position tend to open shorts and wait for the price to break through the support line. Accordingly, a bearish rectangle in trading is formed during a downtrend.
How to use the rectangle pattern in technical analysis for traders
Use the Rectangle Pattern in
Technical Analysissimple enough. To begin with, it is worth understanding what trend preceded its formation – ascending or descending. It is also worth looking to see if there are other, more significant patterns on the chart. The next step is to identify support and resistance lines. This is easy to do by marking the highs and lows of the price inside the pattern. Further, the trader just needs to wait for the breakout. In order to be sure that it took place, it is advisable to additionally use oscillators. The entry point to the position will be the closing of the “breakthrough” candle. Of course, there are other ways to trade “in a rectangle” that differ depending on the overall trading strategy. https://articles.opexflow.com/analysis-methods-and-tools/osnovy-i-methody-texnicheskogo-trajdinga.htm
Is it worth trading inside the pattern? On this score, the experts did not have any unanimous opinion. In fact, each case is quite individual. If the range between the highest and lowest price is small, then there is little point in trading inside the rectangle. Except for those cases, of course, when a trader is not interested in some kind of
scalping .
If the difference between the level of support and resistance is significant, and the pattern develops for a sufficiently long time, then it is quite possible to trade inside it. To do this, you should follow the rules of trading with a sideways trend.
Pros and cons of the pattern
The rectangle is a popular trading pattern. It owes this to a number of its key advantages:
- It can be found in any markets: stock, currency and any other. The figure is absolutely universal.
- The rectangle pattern in trading is always easy to recognize on the chart, as a rule, it immediately catches the eye, even an inexperienced beginner can handle it.
- The figure is not only easily recognizable, it is also quite easy to work with it, without having special additional knowledge and skills. Finding points for opening and closing a position is not difficult for any trader, no matter if he trades long or short.

Mistakes and risks
What can cause errors when trading using a rectangle? Most of them relate to a false definition of a breakdown and, as a result, the wrong choice of the moment to open a position. In order to avoid this, it is enough to use the signs of a false breakout, such as high volumes in the body of the rectangle, candles with long wicks. Another point to keep in mind is that the rectangle does not always remain tied to the original momentum and trend. Often, if the figure is formed long enough, the primary impulse no longer has a significant impact on it. This means that the breakdown can take place in any direction, regardless of the initial trend. The rectangle is also characterized by the general risks of patterns in trading. Here it is worth understanding that patterns do not work in isolation from a trading strategy. Just like behind any other pattern, behind the rectangle there is a certain logic of the market, the behavior of sellers and buyers. If a trader sees only a geometric figure, then he will not be able to successfully use the pattern. Rectangle in trading – trading strategies: https://youtu.be/0z1dL_iQ_i8
Expert opinion
Experts hold different positions regarding the use of a rectangle in trading. John Murphy recommends not being afraid to trade inside the pattern. He explains this by the lower risks that the trader faces in this case, the price is still limited by the consolidation lines. Even if a breakdown occurs, the trader will always have the opportunity to trade in the direction of the trend. Alexander Elder advised to use the strategy of rebounding the price from its edges when trading inside the rectangle. He argued that during the consolidation of prices, you can open good short-term positions. Elder suggested buying at the support line and selling when the price line reaches the resistance level, in order to understand that this really happened, he advised using oscillators or other indicators. Also, in order not to be mistaken in the future trend,



Словесный понос. не более. Треп по материалам Мэрфи – это 40 лет назад. Рынок давно поменялся.
Как точно вы охарактеризовали свой комментарий.
А если по делу, то видел ваши труды и телеграм. Вы явно можете больше и лучше написать то что имели ввиду изначально, но почему-то высказались в такой неконструктивной форме.