In order to create an effective trading system, it is required with a high probability to determine the moment that is most favorable for entering a trade. For this purpose, the simultaneous fulfillment of two conditions is used:
- The trend has been determined, in accordance with which the price is changing now.
- A situation arises in which you can enter a trade in the direction of the trend with a small stop and good potential profit.
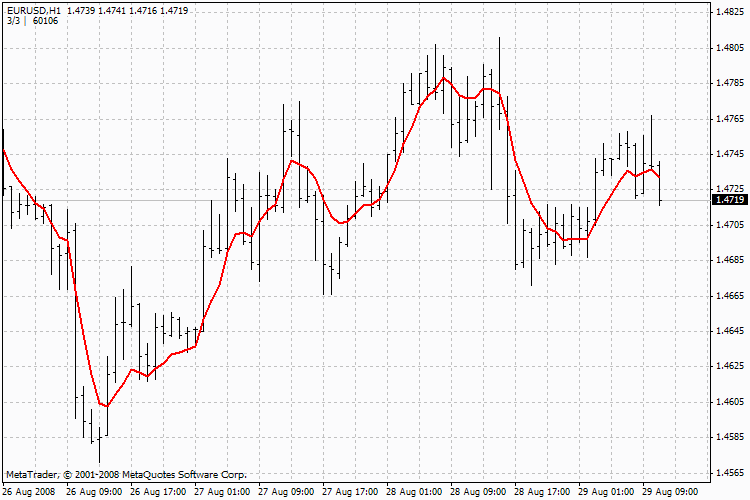
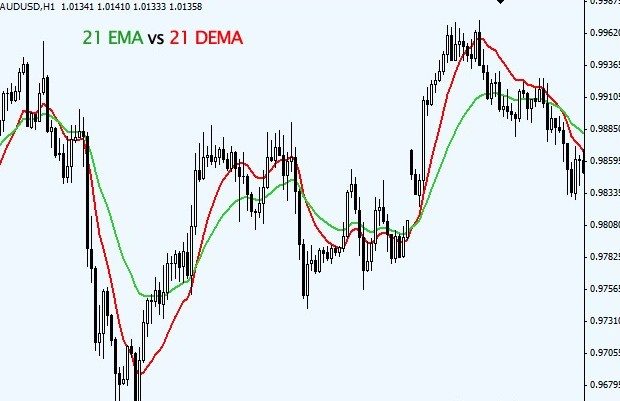
One of the traditional ways to determine the trend is to use the average values of a certain number of bars (candles on the chart). For example, the growth of the average (SMA) of the last 24 values on an hourly chart shows the direction of the chart change over the last 24 hours. The main disadvantage of this indicator is its lag. Thus, a trader, based on his signals, can easily miss an advantageous moment to enter a deal. Technical analysis tools are constantly evolving and, in particular, this has led to the emergence of a special method for calculating averages – EMA. Its difference lies in the fact that when calculating the average, the values are taken with certain weights, and the latter will have more. Thus, the average will show the presence of a trend, but its lag will be less compared to the usual average.The DEMA indicator is a further development of this idea. In this case, first the EMA is taken from the asset price, and then the EMA is taken from the obtained values again.

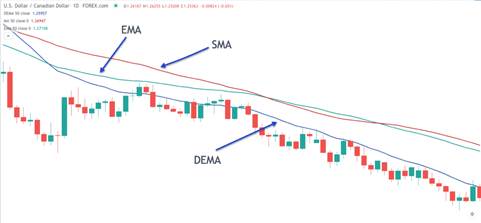
Practical use
Double Exponential Moving Average can be used directly, but more often it is used in the following variant:
- EMA is calculated based on the asset price values.
- Read DEMA from this indicator.
- Indicator = (2 x EMA) – DEMA.
You can use this average in other ways as well. Using DEMA allows you to determine if there is a trending price change. If the latter is above the indicator, then the trend is upward, if below, then the downward trend. This method allows you to objectively assess the trend, but the trader needs to choose the order of the average used.
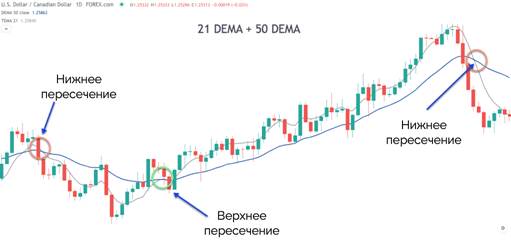
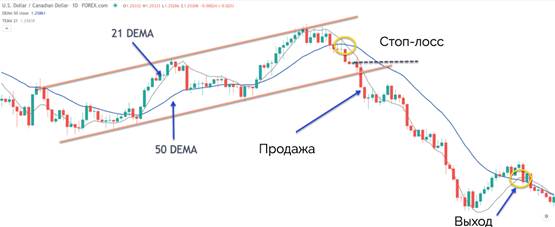
How to use DEMA and how to configure
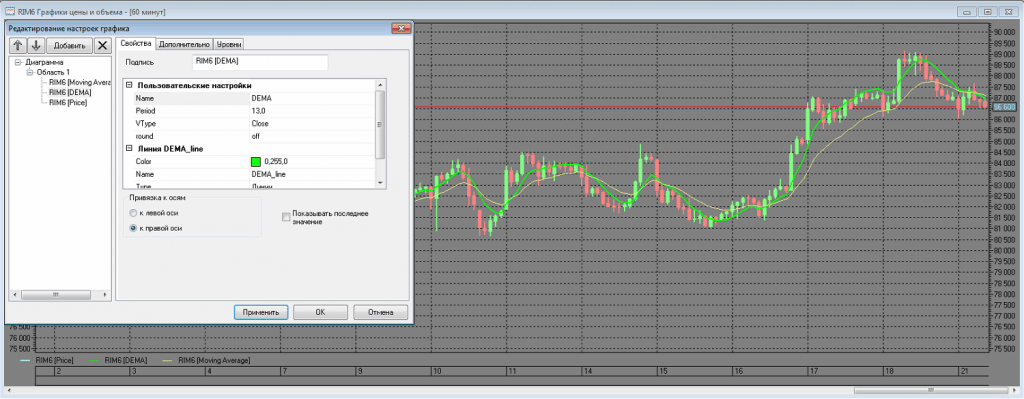
To use the DEMA indicator, you must select a period for it. It determines the number of the last bars for which it is calculated.
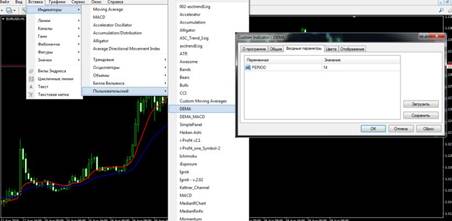
- First, the resulting archive must be unpacked.
- You need to start Metatrader 4, then open MetaEditor.
- In the main menu, go to “File”, then click on “Open”.
- Select the unpacked DEMA indicator file and open it.
- Then click the “Save as” line. After that, the file will be saved in the indicators directory.
- Then in Metatrader go to the “View” menu and open the navigator. Double click on DEMA in the indicator catalog.
- After that, it appears on the chart.
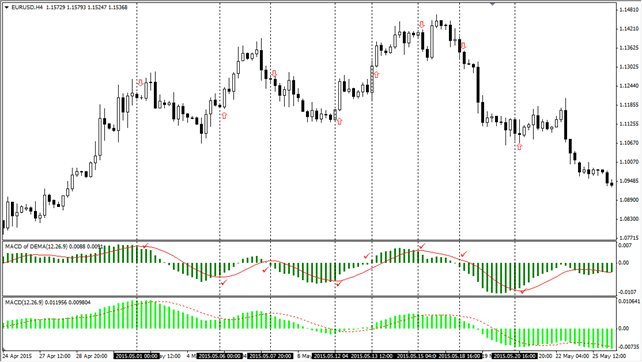
The file downloaded from the link offered here also contains the DEMA MACD indicator. It is installed as it is written here. The use of the indicator is explained in the attached figure. Using DEMA MACD:
Difference from adjacent indicators
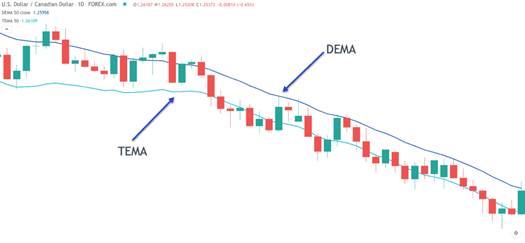
When using DEMA, the question arises whether it is worth reducing the indicator lag even further by taking the EMA from this indicator again (the indicator obtained in this way is called TEMA). It should be understood that a relatively slower change in the average helps to more accurately determine the direction of the trend change.
