The Fibonacci sequence is a numerical sequence in which each next term is the sum of the two previous ones:
1,1,2,3,5,8,13,21,34,55,89, … These figures are connected by a number of interesting relationships. Each number is approximately 1.618 times the previous number. Each use case corresponds to approximately 0.618 of the following. 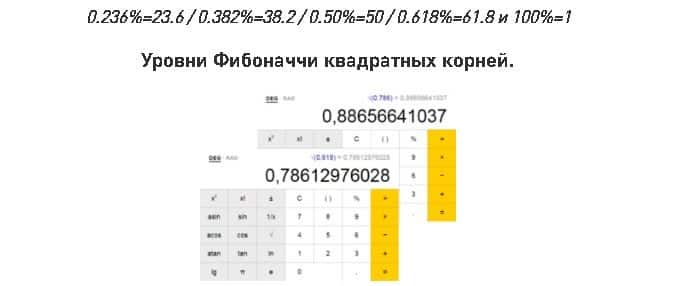
It turns out that when analyzing the market, several basic levels are used: 0.0%, 23.6%, 38.2%, 50.0%, 61.8%, 76.4%, 100.0%, 161.8% , 261.8% and 423.6%, the most active. of which 61.%.
These seemingly ordinary numbers make a lot of sense, and let’s see how to use them. Fibonacci patterns are best used in conjunction with other patterns and indicators. They often point to a more general approach. The Fibonacci extension will give you a specific price target, but it makes no sense unless you know a breakout is likely. The Fibonacci price estimation test requires a triangular pattern, volume confirmation, and an assessment of the overall trend. By combining indicators and charts with the many Fibonacci tools available, you can increase your chances of a successful trade. Remember that there is no single metric that shows everything is perfect (if there was, we would all be rich). However, when many indicators point in the same direction, you can get a good idea of where the price is heading. 

How to use Fibonacci Channels?
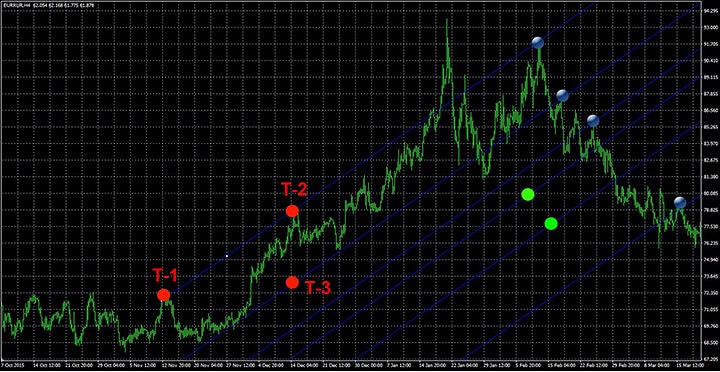
The strategies for using the channel can be different, the less risky it will be to buy an order in the direction of the current trend when the timeline bounces off the line along which all construction is completed. The order should be closed when the price reaches the level and there are signals of its rapid reversal. Why use a technical indicator from a group of oscillators or a Price Action strategy without an indicator? The latter option is better because it provides more accuracy. Depending on the usage strategy, the channels will not differ from Fibonacci levels, but can be used for global trend movements and high volatility. The essence of the technical analysis tool Fibonacci channel – construction, interpretation of results, practical application in trading: https://youtu.be/izX0GDoupGA
The author’s strategy for using the Fibonacci channel
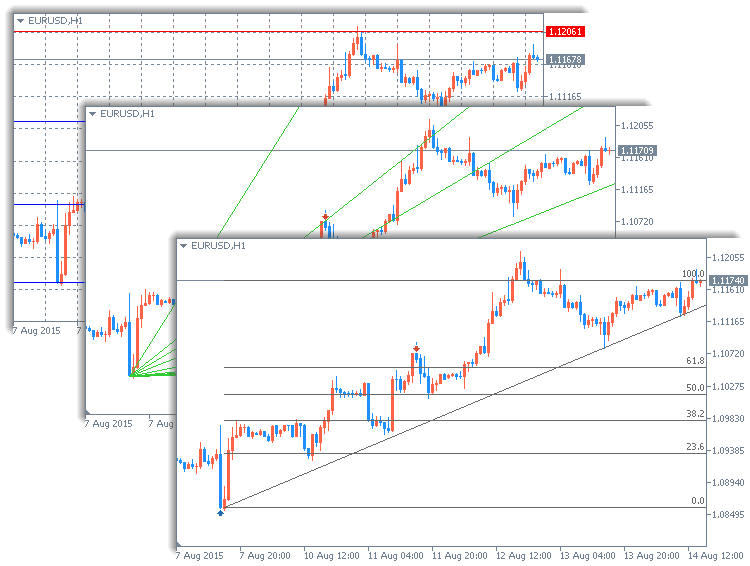
One of the strategies for using the Fibonacci channel is to test its signals not immediately, but by changing the direction of price movement. If the asset is in an uptrend, the Fib channel will not stretch higher (as shown in the sidebar above), but lower, as if it were in a downtrend. In this case, the construction is carried out according to the extreme values of the price movement, which form the same “shores” that limit the construction of the chart. When the construction lines are broken, movement levels are obtained to confirm the change of direction and determine the exact time of the opening commands:


A justified channel is a channel organized on two low and two high points. However, in practice it often happens that after its confirmation, the channel changes direction.
Let’s test the price movement forecast in the future channel. Fibonacci levels will help us here.


Correction levels based on Fibonacci
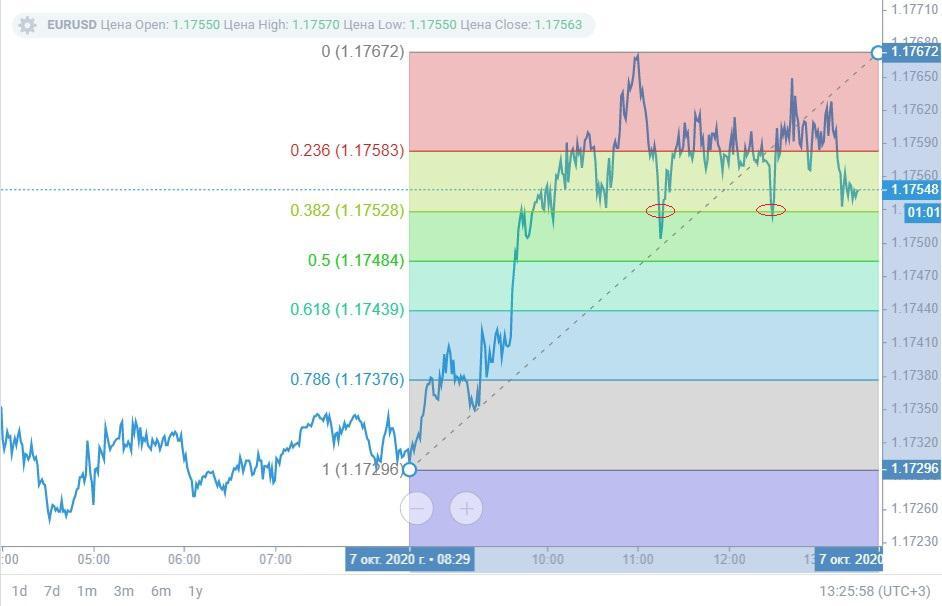
This is the simplest use of Fibonacci numbers. They are based on the fact that the trend can be divided into 6 parts, and any part will have a certain value. To build a Fibonacci grid (sometimes referred to as levels), you need to find a reasonably clear up or down trend and drag the grid from start to finish.
Pros and cons of the Fibonacci tool
The key advantages of the indicator are the ability to:
- predict profit targets and stop losses accurately;
- promptly execute pending orders;
- use trend and anti-trend strategies;
- work at any time, both in the middle of the day and at long intervals.
The main disadvantages of the indicator:
- not suitable for small TF;
- it is more difficult to build algorithmic strategies according to Fibonacci than according to other indicators. Because of this, it is more difficult to test on a large number of instruments in order to find out the true Fibonacci indicators in trading;
- difficulty in determining the starting point (beginning of a trend);
- uselessness of the indicator on flats.
After analyzing all the pros and cons, we can conclude that Fibonacci can be used as an additional technique to determine our positions, but only as an additional one. Don’t buy or sell 50%, 61.8% at random and expect positive long-term results – the markets are overly complex to guide one Fibonacci value.
