What is a level breakout in trading and how to determine it, how it looks on the charts, a false and true level breakout. Every person who chooses a job related to financial transactions, trading on various specialized platforms and employment in trading should know and understand well what constitutes a breakdown of the level. This concept is included in the main professional terminology, which is necessary for everyone who intends to develop in trading and gradually increase profits.
- What is a level breakdown
- Characteristics and types of breakdowns
- What is important for a trader
- Why breakouts happen
- Analysis of real breakdowns
- False breakout analysis
- Market actions on the eve of breakouts
- True and false breakdown – detection methods, “play” in the market
- Resistance level breakout
- Support level breakout
- Breakdown of the level on the glass
- How to build a system based on the breakdown of levels
- Trading strategies
- Where else to use the breakdown of levels
- How to identify breakdown
- Chart examples
- Advantages/disadvantages of using breakout trading systems
What is a level breakdown
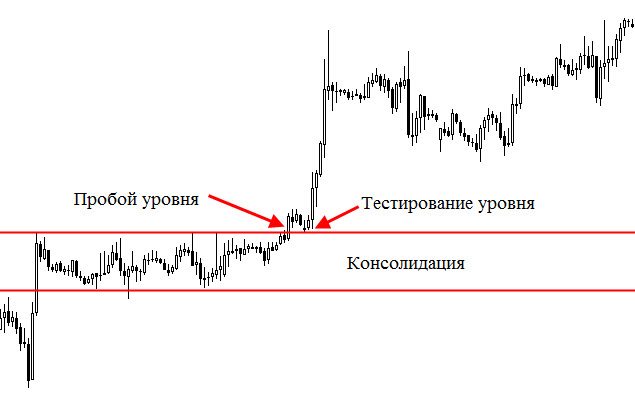
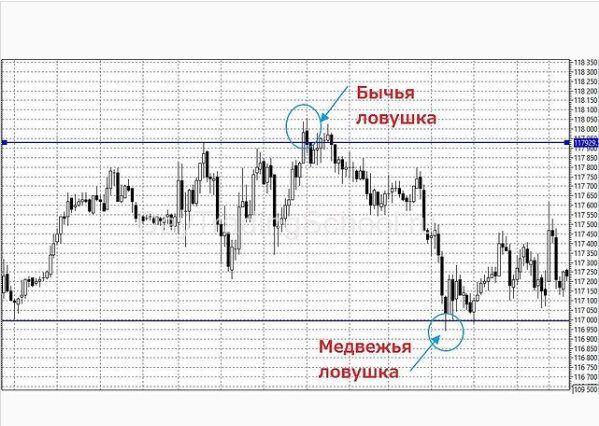
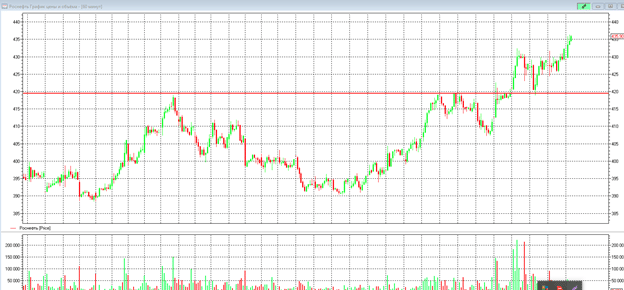
Many people prefer to trade using the breakout of a level as a guide to a successful trade. It must be borne in mind that such a method may be unprofitable, since various points and nuances must be taken into account. To begin with, it is recommended to study what the concept in question is. It is not enough to simply notice that the price is starting to break through the resistance level. It is present, for example, on bullish candles. You should not immediately postpone the deal (long). The reason is that the price may reverse, resulting in losses. In order to avoid such a situation, execute a trading plan or make a profit, you need to know what a level breakout is. The concept is a price fixing for any level. Then there is its further movement towards the breakdown. Beginners must understand that consolidation is the closing of a candle after a level. Breakouts can occur at different levels (horizontal or vertical) and can also be bearish or bullish (sometimes referred to as traps). It looks like this:
Characteristics and types of breakdowns
Studying the features, it should be noted that the breakdown can be true and false. As a characteristic, it should be noted that they occur because the price holds below the resistance level for a while or rises and remains above the support level. Later, the resistance level becomes the line that is usually marked on the charts. They are also actively used to set entry points or stop-loss levels. When the current price breaks through
the support or resistance leveland broke through, then in order to avoid losses, it is recommended to close positions. A breakdown can also very often be associated with such a phenomenon in trading as a surge in activity. It triggers a subsequent rise in volume if other bidders have shown interest in the breakout level. https://articles.opexflow.com/analysis-methods-and-tools/podderzhki-i-soprotivleniya-v-tradinge.htm
What is important for a trader
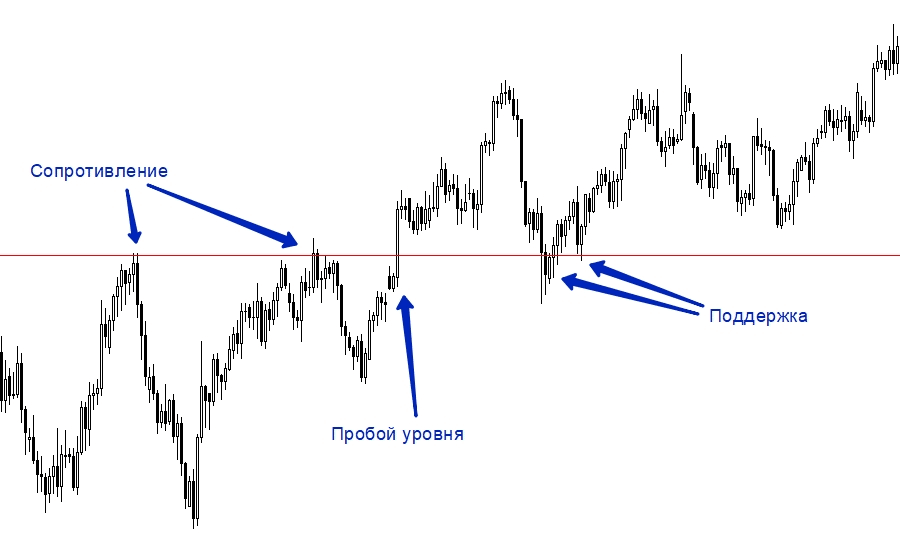
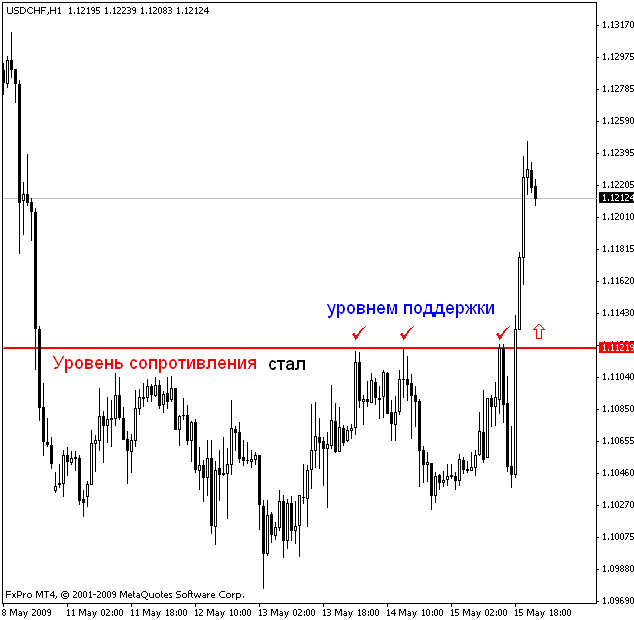
It is necessary to take this into account, because trading on a breakdown of the level is associated with risks. It is also important to know that if the volume is above average, then it helps to confirm the breakout. Another point that should not be missed is that in the case when the volume is low, then the level may be unnoticed by other participants. This point is important when you need to place a trade, but in this case, the risk of going into the red increases. If the breakdown goes up, then the moment concerning the withdrawal to the minus is important here. In this case, the price will inevitably go below the resistance level. Another important point: when the breakdown fails, the price rises again. The indicator is fixed above the support level, below which it broke through. Here you can see the support and resistance levels on the chart:
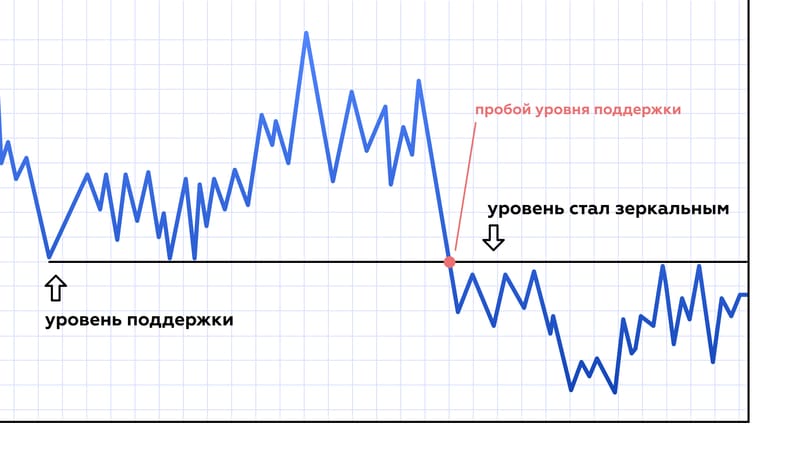
All of these patterns are formed when the price moves in a certain way. Under the influence there is a change of levels. They can go long or close short. This happens when the price breaks through the resistance level. If it breaks through the support level, then short positions are opened and long positions are closed.
Why breakouts happen
You need to know why breakdowns happen, what factors affect it. For this, one of the options must occur. In the first case, traders independently strive to set the price in motion (up or down, depending on the situation). Here you need to take into account that you need to have the strength to then maintain the volumes that have appeared. So, if the bearish volumes are stronger, the price indicators will start moving down. The trend will not form. A breakout can also happen when large players gain positions. They thereby push the price to break through the upper level. After that, in 90% of cases, trading stops, the price returns to its usual positions. This approach is often chosen precisely to obtain guaranteed profits.
Analysis of real breakdowns
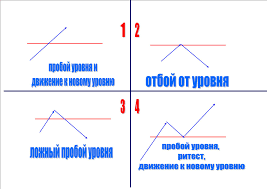
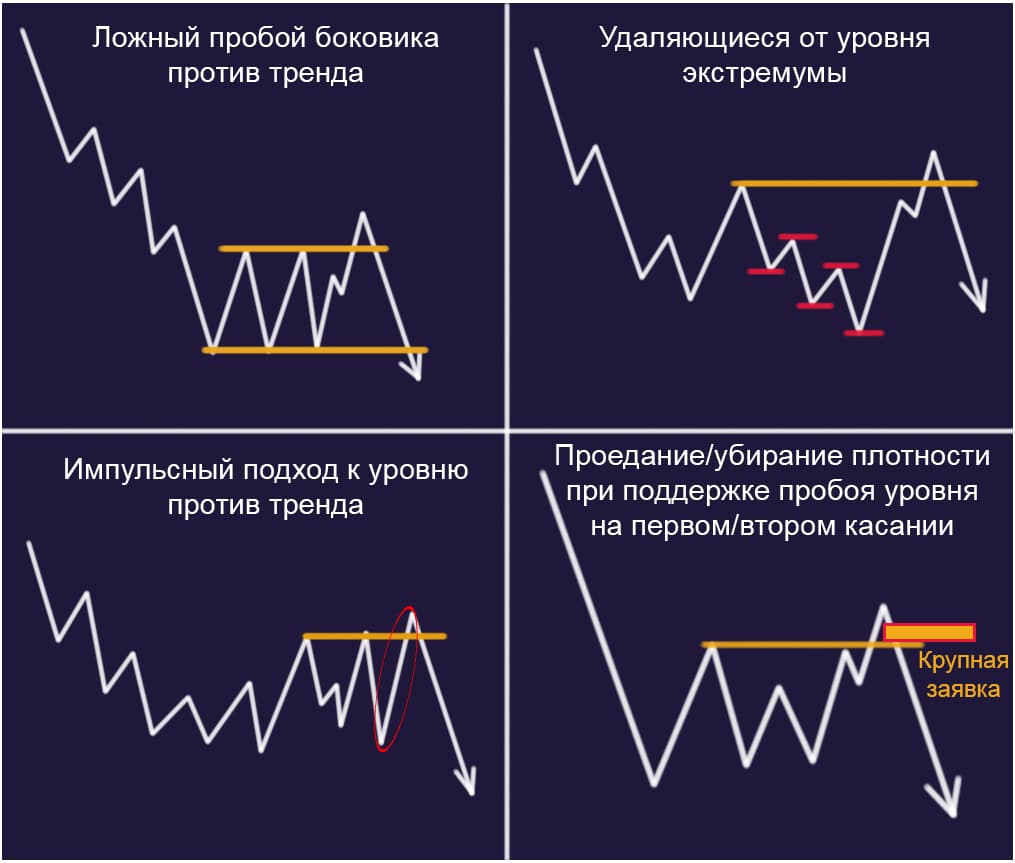
It is known that trading has a direct impact on the breakdown of the level. It should be borne in mind that there is no way that would give a complete guarantee of a successful transaction. During the analysis, you need to use ideas based on observations of the market. They allow you to increase the chance of a correct, that is, a real breakdown. In this case, the price will show growth, volumes will increase. A real breakout is carried out when the liquidity of the range levels has become minimal. Feature: at least one false break must occur in order for the market to move up.
False breakout analysis
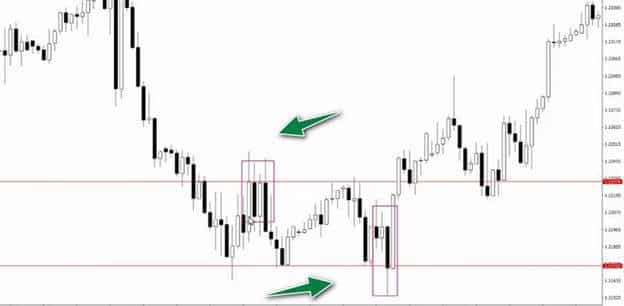
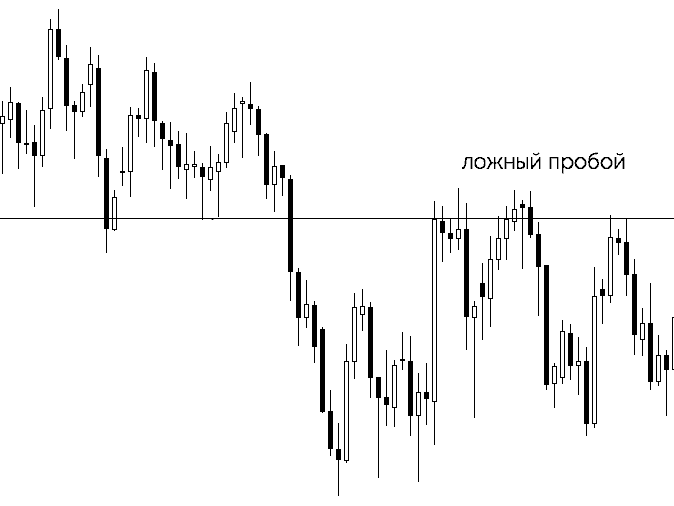
No less important during trading is a false breakdown of the level. His analysis also lies in the fact that you need to carefully monitor the movements that occur in the market. The price will indicate how the situation will develop. In the case of a false breakout, you can observe how the price moves above the resistance level and at the same time below the support level. Then almost immediately you can see a reversal. The analysis shows that false breakouts occur in the market when there is an insufficient number of buyers. There may also be a shortage of sellers who could, by their actions, provide sufficient liquidity and price movement directly in the direction of the breakdown. This is how it looks on the chart:
Market actions on the eve of breakouts
The market must know how to identify a false breakout of a level, or a real one, even before they occur. This is required in order to choose a strategy in a timely manner, as well as fix profit indicators or reduce the likelihood of going into the red. In the market immediately before the true breakdown of the transaction and the applications of the opponents of the movement will be minimal. Large transactions in the direction of a true breakdown move the price in the corresponding direction. This indicates that there is no interference. If the trade is unprofitable, then the seller can exit it before the market closes.
True and false breakdown – detection methods, “play” in the market
There are various methods for determining whether a level breakout is true (real) or false, which will happen in the near future, but it must be done before the start of the main events in the auction. This knowledge will help make trading stable, increase the likelihood of making a profit. False and true breakdown, rebound and breakout of levels in trading: https://youtu.be/gKd-dYiD3rM
Resistance level breakout
In this case, the current market situation will allow you to determine in time the most opportune moment for the implementation of a profitable strategy. In 90% of cases, it indicates what exactly can happen during the auction, as well as with what probability certain events will occur.
Support level breakout
Breakdown of the level on the glass
To make a profit, any strategy can be chosen to break the level by the order book. In this case, suitable instruments and volumes are used, which must be chosen, focusing on the situation in the market. Levels should be easily distinguishable. It can be a certain maximum for a certain period of time, for example, for a month. Breakout of the level on the order book from the entry point should be performed if there is a high density congestion. It is recommended to enter within the glass according to this strategy if about 25% of it remains. If you do everything in accordance with the instructions, then you can expect an impulse that will allow you to quickly exit with a guaranteed profit. The momentum can be explained by such a phenomenon as the triggering of stops behind the level. Another important point is that in the case when there is no movement, the position should be closed.
How to build a system based on the breakdown of levels
To do this, you need to remember that under the breakdown of the level, it is customary to consider the closing of the trading session above the high, or below the low of the trading range. The price should have been in it during the entire trading session. Closing makes it possible to conclude that at the current time there are more willing to buy, if the breakdown goes up, than sellers. Focusing on the current situation, taking into account subjective factors and the moment of risk, you can choose the optimal strategy and act on it.
Trading strategies
Any existing trading strategy against the background of a level breakdown can bring profit to a trader. If you choose to open positions, then the entry point will be exactly the moment of the breakdown. The choice of entry point depends on:
- The selected tool.
- situation specifics.
- person’s preferences.
You can open yourself or use automatic opening orders (in this case, you can use only the set price).
Holding and closing positions is a strategy for those who prefer short-term trades. Gives you the opportunity to earn high profits.
Where else to use the breakdown of levels
Breakout can be used in trend trading in channels. In this case, the breaking of the descending line will be the first main signal for the end of the trend. It is also a symbol of a possible trend reversal.
How to identify breakdown
The breakdown is determined by the beginning of the price movement. As soon as changes in this indicator are observed, a high probability of a breakdown can be judged.
Chart examples
An example of a false breakout:
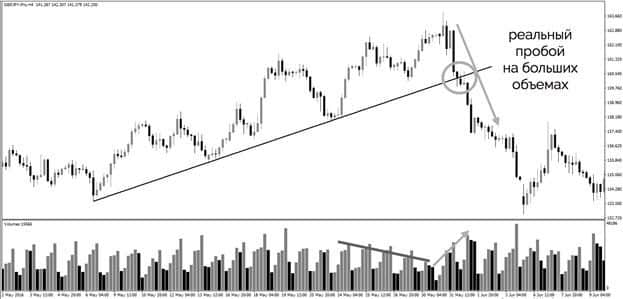
: A breakout of 
:
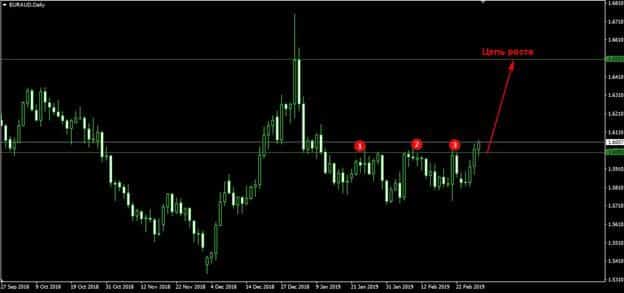
Advantages/disadvantages of using breakout trading systems
Pros:
- Financial benefit.
- Quick learning of the functions and features of the stock market.
- An opportunity to study the nuances of the market movement.
Breakouts teach you how to buy highs and sell lows. With their help, a person learns how to correctly and timely use a stop loss or take profits. It is also easy to follow the existing trend, to understand the nature of many events taking place in this area. The main disadvantage is the creation of a tense psychological situation. It’s called “saw motion”. As a result, many traders make mistakes that lead to losing trades.
