What is a pin bar, pin bar trading strategies. Pin bar (full name Pinocchio bar), or royal candlestick, is one of the most common reversal candlestick patterns that warns of a trend reversal. This pattern was first described by Martin Pring as a candle with a short body and a long shadow facing the price movement. A candle seems to predict the direction of the trend, but practice shows that the longer its shadow, the greater the likelihood of a trend reversal. Pring drew an analogy with the hero of the fairy tale Pinocchio, whose nose grew due to deceit.
- Basic Pin Bar Structure
- Pin bar formation mechanism
- How to trade a pin bar
- Pin bar trading strategies
- moving averages
- stochastic oscillator
- Pin Bar Dashboard
- Pin bar trading mistakes
- Persistent waiting for a pin bar
- Waiting for a radical trend reversal
- Similar interpretation of each pin bar
- False pin bars
- Multiple consecutive pins
- Double pin bars
- 4 bars in a row
- Choosing the best pin bar
Basic Pin Bar Structure
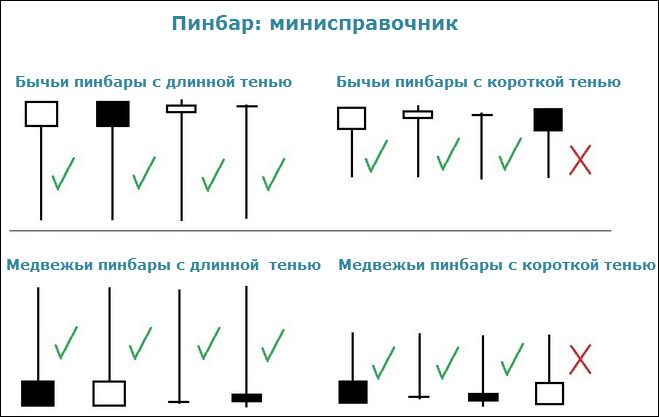
The pattern consists of a single candlestick with a long shadow (2-3 times longer than the body), in addition, the length of the pin bar shadow must exceed the length of the shadows of all neighboring candles. The shorter the body of the pin, the more reliable the signal. Sometimes a royal candle may not have a body at all, i.e. the opening price is equal to the closing price.

- A bearish pin (upper shadow, the body is black, dark or red) signals a fall in price.
- A bullish pin (lower shadow, white, light or green body) is a price increase signal.

- the maximum (minimum) of the candle should not go beyond the borders of the nose (royal candle);
- the closing of the royal candle should not pierce the maximum of the eye.

- the right eye should not be longer than the middle candle of the nose;
- the right eye should break the low (high) of the royal candle and close below (above) its limits, confirming a trend change.
Pin bar formation mechanism
The picture below shows an uptrend, the price was rising, the market was dominated by buyers. Then demand dropped. For traders who placed buy orders, stop losses were triggered, for traders who placed sell orders, orders were triggered. All this led to the fact that the reversal candle had a short body and a long shadow.

trend .
How to trade a pin bar
A pin bar is a reversal pattern, which means that you need to open trades against the trend (in the direction of the expected rate).
Stops are usually placed 5-10 points behind the pin’s shadow. Setting a profit is not regulated, usually the range of the royal candle serves as a guide. In different strategies, the points for opening positions may differ, but 3 options are considered the main ones:
- entry at the opening of the next candle after the formation of the pin bar;
- entry some time after the opening of the candle following the pin bar , because the price may try to re-pass the same level;
- entry 1-2 candles after the close of the pin bar ; in this case, the entry point will be as reliable as possible, but the trader loses the possible profit compared to the earlier opening of transactions.
When determining a pin bar, it is necessary to take into account not only its structure, but also its location. The reference point is the appearance of a royal candlestick near the borders of the channel formed by support/resistance levels or technical levels (
Fibonacci , Murray levels and others). Do not trust pin bars that form in the middle of the channel.
Pin bar trading strategies
When choosing a trading strategy using a pin bar, there are some key points to consider:
- pin bar detection;
- determining the entry point to the market;
- setting a stop and profit;
- deal management.
moving averages
Two EMA lines with a period of 200 can serve as S/R levels. The opening point of the transaction is the rebound of the royal candle from the upper or lower moving average. Stops are set at a distance of several points from the opening or closing points of the candle. In a similar way, they trade using
Bollinger bands (an improved version of moving averages).

stochastic oscillator
With the help of stochastics, it is recommended to trade on small timeframes, for example, M30. When a bearish pin appears, the stochastic should update the high and enter the overbought zone, only after that a short position is opened. When a bullish pin bar appears, the stochastic should update the low and enter the oversold zone, after which a long position is opened.

Pin Bar Dashboard
This indicator is designed specifically for identifying pin bars. When a royal candle appears on the chart, the indicator beeps and marks the reversal candle with an emoticon.

Pin bar trading mistakes
Persistent waiting for a pin bar
Royal candles often appear on the chart, especially on small time frames. But don’t focus too much on individual patterns or you may miss out on many more profitable opportunities.
Waiting for a radical trend reversal
The chances of a strong uptrend reversing after a bearish pin are negligible. For a radical trend reversal, much more weighty reasons are needed. therefore, you should not open long-term trades with every pin bar.
Similar interpretation of each pin bar
When determining a reversal candle, all indicators are important: the length of the shadow, the size and color of the body, the type of neighboring candles. For example, the appearance of a small bearish pin bar with a short shadow and a short body after large bullish candles indicates that the buyers have not lost control of the situation yet, the market has just paused.
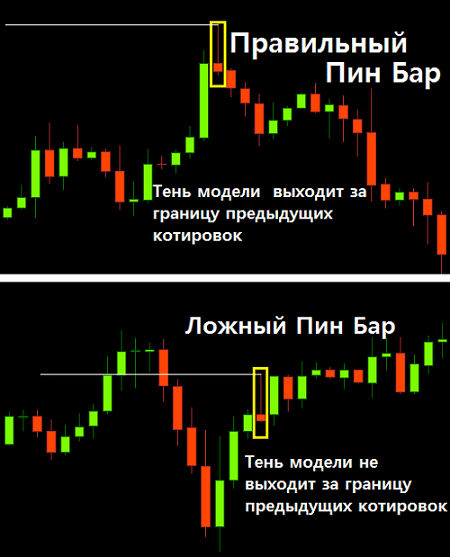
False pin bars
Like any other pattern, pin bars can give false signals that do not lead to price changes. False pins look like true pins, except for two things:
- false pins appear in the middle of the channel, quite far from the support/resistance levels;
- the shadow does not touch past lows (highs).
Multiple consecutive pins
We have analyzed the strategies for trading with a single pin bar. But what if the chart forms several pins in a row?
Double pin bars
Double Pin Bar is a fairly common pattern that forms near S/R levels. The appearance of the second similar bar is an additional confirmation of the price change.

4 bars in a row
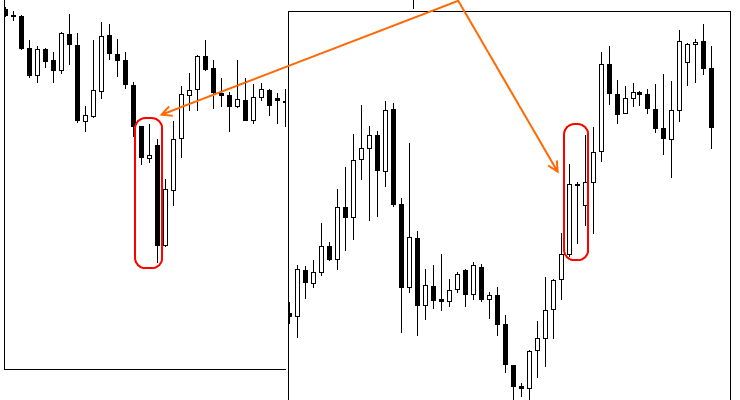
Sometimes real exchange situations baffle even advanced traders. This situation occurred on 01/24/2014, when 4 consecutive pin bars formed on the EURUSD chart, with the first two pins being bullish and the second two being bearish.

- First, the bearish pins had strong support from the 50% Fibonacci resistance line.
- Secondly, if we change the timeframe to H1, we will notice a clear downtrend. In this case, the probability of a reversal is extremely small.

Choosing the best pin bar
Simple and unpretentious at first glance, pin bar trading strategies have many nuances. Royal candles appear on the chart quite often and you need to learn how to find the most profitable trading moments. Consider an example of choosing the best pin bar on the chart below.


- placing a pending order;
- entry at the close of the candle.
Time shows that our assumptions turned out to be correct – a bearish pin was formed. Taking into account all the conditions for the formation of a pin (a downtrend, the dominance of bears, reliance on the S/R level), there is no doubt about its reliability.

