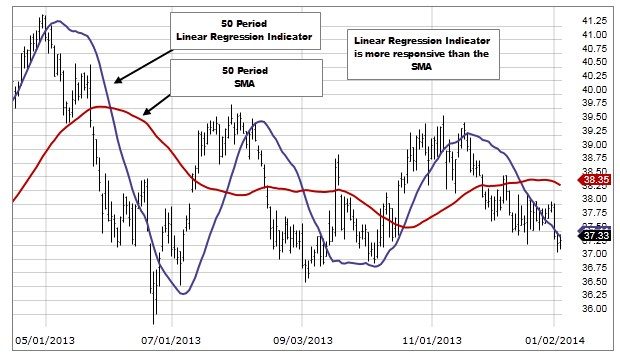
Linear Regression Indicator (LRI) – what is the essence of the indicator, trend analysis. Linear Regression, which is called the linear regression indicator, has become an important component of technical analysis when trading different assets. In 1991, it was created by Gilbert Ruff, since then it has been actively used in various platforms. Unlike other analogues, it is easy to use, allows you to obtain objective data, with which you can make accurate forecasts for price trends.
Description of the linear regression indicator
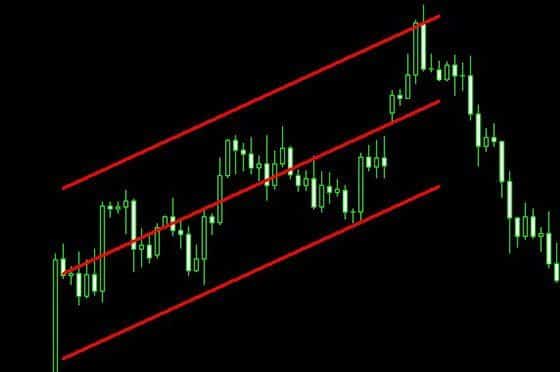
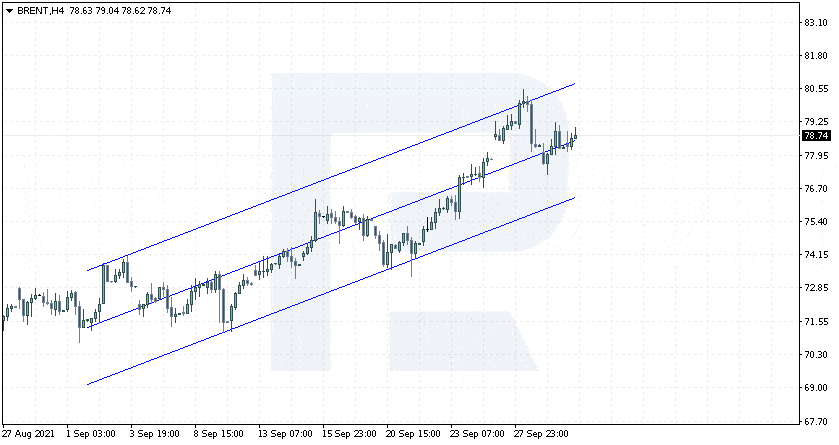
The linear regression indicator has a graphical expression. Visually, it is depicted in the form of a channel created by parallel straight lines. Inside them there is another straight line, located at the same distance from the extreme lines, it shows the price movement in the market. The width of such a corridor is set by the trader using a frame. The upper line shows the maximum deviation of the price from the emerging trend, and the lower line shows its minimum value. This is a universal tool that can be used when working with any asset sold on the exchange. Using the created lines, you can determine different movements of the current price, creating a price channel on the chart, which reflects the maximum, minimum and middle of the price movement. First, an average line is drawn, which is called the “regression trend line”, based on the value of the trend price. Its slope depends on where the market trend is moving. After that, the indicator adds two equidistant lines that represent resistance and support for the price movement over a certain period of time.
Lines of the Linear Regression indicator:


Setting up the indicator in the trading terminal
In the menu, select the item
“Insert” , and then the section
“Channels”
. They select
“Linear Regression”. For subsequent settings, you need to select the desired point on the chart, from which the linear regression channel will be built. The cursor is hovered over it, and then the left button on the mouse is pressed. After that, without releasing the key, you need to drag it to the desired mark on the timeline. This is the final stage of channel building. After that, you only need to set the desired width for it, which in the MT4 program is located in the Fixed Date Time section. Only the working date is set here, which depends on the time of the set timeframe. The user can use the data of one day as time periods. The program will calculate the coordinates of the regression line based on the given price values in the interval between the two specified points.
To change the specified interval, double-click on the middle line and drag the desired one from the highlighted points.
You can enter the properties menu of the constructed channel by right-clicking anywhere in the price chart window and in the drop-down menu select the “List of objects” item, where the “Channel registration” section is selected, in it the “Properties” section is selected.
How is it used
Such a tool is installed today in many trading platforms. To add it to the chart, you need to select it from the menu. To use the linear regression indicator in the MT4 terminal, you should find it at the top of the window. To download, you need to click the following buttons in sequence, hovering over them:
- first “Insert”;
- then select “Channels”;
- then click on the “Linear Regression” section.
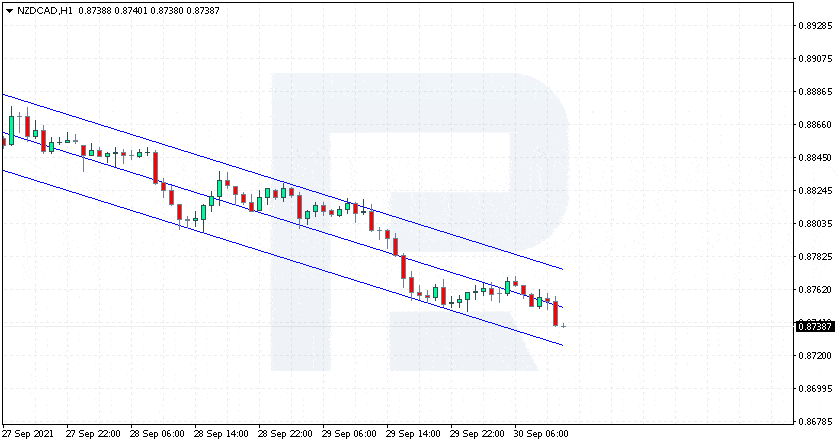
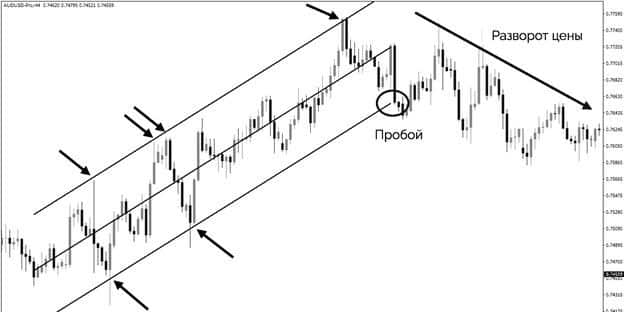
After that, the program will be activated on the computer. After activation, it can be used by a trader in building charts that will help determine the price trend in the market in a given time perspective. To draw a channel, select the beginning of the trend and drag the indicator to the next critical point of the trend. By projecting the top and bottom of the price trend onto the chart, you can make the channel self-regulate. In this case, the middle line automatically takes its position between the upper and lower parallel lines. When determining the points of entry and exit from the market, you should follow the interaction of the price with the upper and lower lines. As soon as this happens, it means that the current price value will change soon. When it interacts with the middle line, it means that the current impulse price begins to form, which shows the continuation of the current price trend. When conducting a regression analysis, you need to monitor the breakdown of the created corridor. When the price breaks its integrity in the direction opposite to the main trend, this means that in this situation the price direction in the market may change in the near future. The analysis is based on observing how the price interacts with three parallel lines that create a corridor. At the moment when it begins to interact with the lower or upper border of the channel, you should be prepared for the fact that in the near future the price trend in the market may change dramatically. The trader will just need to watch how the price will interact with the built indicator lines. At the moments of interaction at the top or bottom of the channel, the price movement will change in the near future. This will be an indication that when the price drops, you can enter the market, and when there is a decrease, you can exit it. An example of a bullish corridor where the price keeps lower:
Pros and cons of using
Linear Regression is considered one of the most convenient and promising indicators for a trader. With its help, you can always find out exactly the trend changes in the market, their direction and strength in order to have time to report on upcoming adjustments. The disadvantage of such a tool is that after the bar closes, you need to redraw the charts again. When interpreting the received indicator signals, it is necessary to take into account a number of points:
- the rise of the line on the chart means an upward trend, and its lowering indicates that a downtrend will prevail in the near future;
- when the value rebounds from the boundaries set opposite the trend, one should prepare for a rollback; in the opposite situation, one should expect prices to recover;
- repulsion of the cost from the side lines allows you to count on the fact that the established trend will continue its movement.
Features of using Linear Regression
This is a universal tool that is suitable for use in various areas of trading:
- in scalping ;
- for flat;
- in mid-term trading;
- determining the direction of the trend.
The basic principle of a linear indicator is that the price will change within the regression channel itself. Such a tool allows you to close and open trades, while remembering that you cannot trade against the current trend. Linear Regression is perfectly combined with other tools that a trader uses, based on the trading strategy used, type of trading, personal preferences: Stochastic, Bollinger and other tools used by the trader. The objectivity of the linear indicator Linear Regression is guaranteed by the fact that it works on the basis of a specific mathematical form, so the role of the subjective factor in trading is minimized. At the same time, it should be understood that in order to obtain accurate information that allows you to make an error-free decision, you need to use additional technical analysis tools along with the indicator. With their help, it will be possible to eliminate unnecessary noise and accurately determine the entry and exit points. Setting up such a tool and using it at work is easy if you follow the instructions described above.
