What is a trend line in trading, how to build and use in trading, what types are there, creating trend lines.
Trading or stock trading is becoming more and more popular. It seems to a person who is far from understanding financial markets that you can earn a lot quickly and a lot. At the same time, the actions are chaotic due to the lack of knowledge about the analysis tools. This may lead to a result contrary to expectations. Mastering the rules of progressive promotion in exchange trading can be started by considering a simple and common method of
technical analysis – building a trend line.
- Trendline: what is it and how to draw
- What is taken into account when plotting a trend line?
- Rising trend line
- Downtrend Line
- What can be determined from the trend line?
- What will tell the trend line at the auction
- What is a market reversal and how to see it
- What trading strategies are built along the trend line?
- Trend Entry Strategy
- Rollback strategy
Trendline: what is it and how to draw
The trend line is one of the fundamental concepts that any trader needs to know. Exchange movement of prices and indicators is not chaotic. It obeys certain rules. Trends in the course of processes are clearly visible using a graphical representation in the form of a trend line. The importance of the correct use of this tool is due to the fact that the trend line will allow you to:
- correctly navigate with the price level for a financial instrument in the future;
- competently build your own trading strategy with a more efficient use of stock indices.
Analysts consider the trend line to be the simplest tool showing the predominant movement of indicators. https://articles.opexflow.com/strategies/trend-v-tradinge.htm
What is taken into account when plotting a trend line?
When plotting, it is important to consider what type the trend belongs to in a fixed time period. Three types of trends are considered:
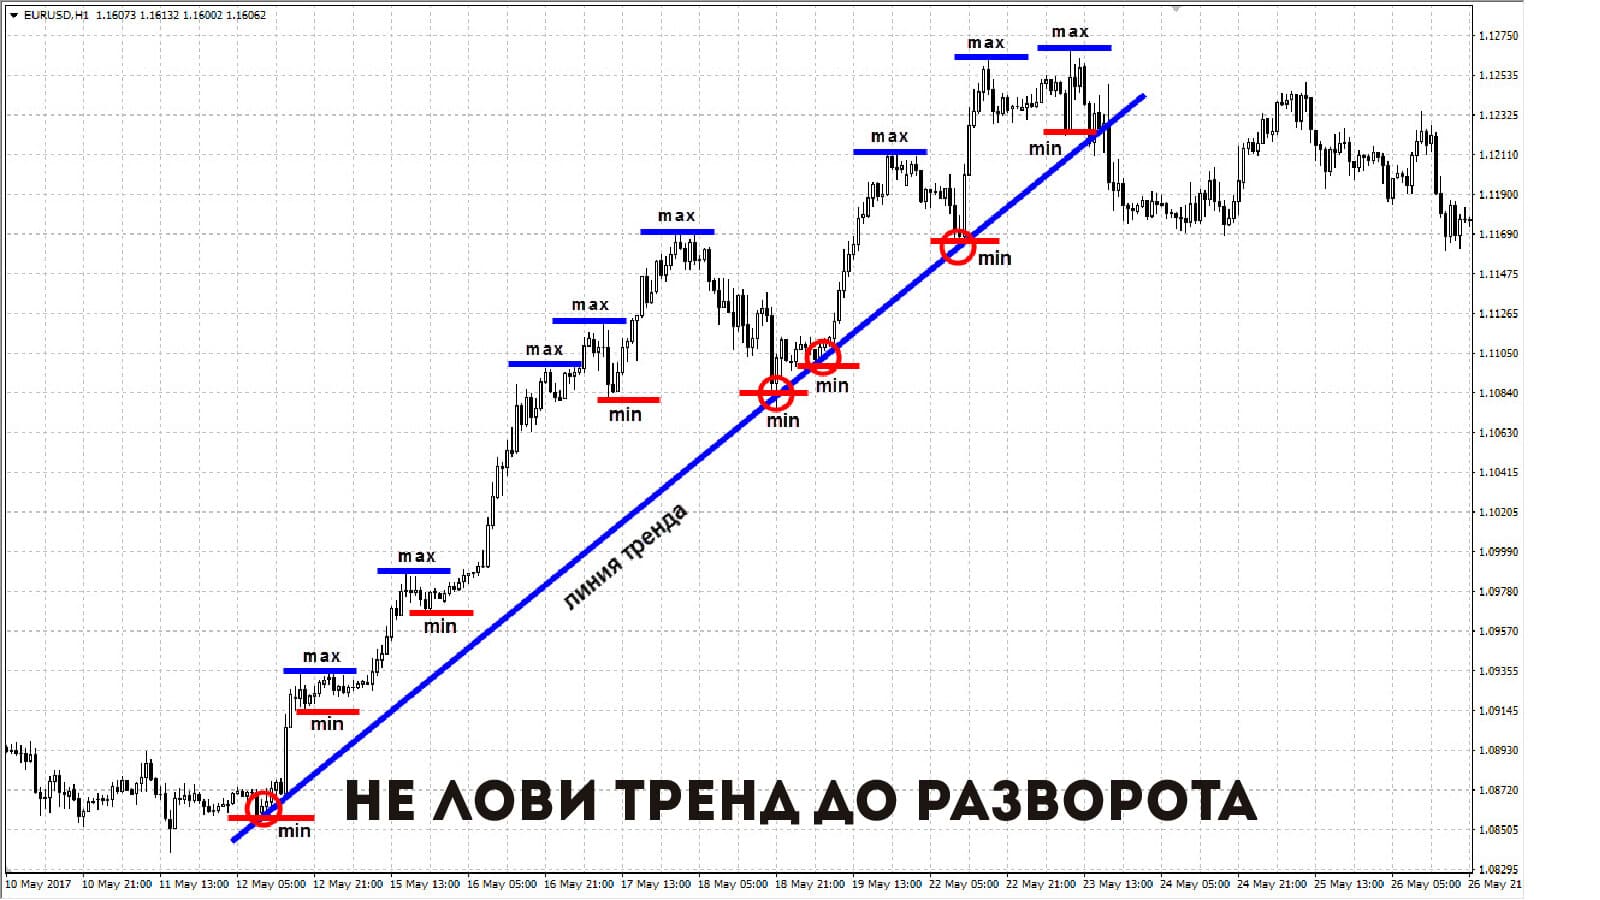
- An uptrend or uptrend (“bullish”) reflects an uptrend in the market.
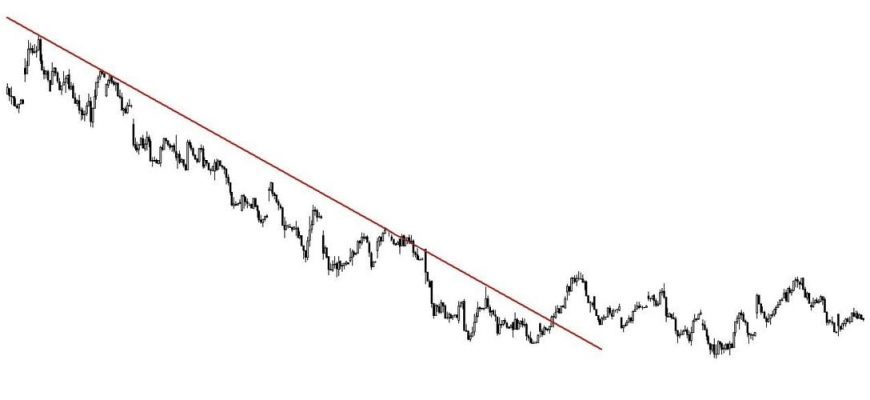
- Descending or downward (“bearish”) shows a decrease in quotes.
- Flat – the actual absence of changes in the behavior of the market (trend). Over time, the indicators are constant.
Rising trend line
The straight line connects the lows on the upward bullish chart and is the support line. It is located below the stock chart. If the remaining points of the minimum peaks touch this straight line, then they are called “bounces”. If at least 3 “bounces” are in contact with the straight line, then it can be taken to build a forecast. 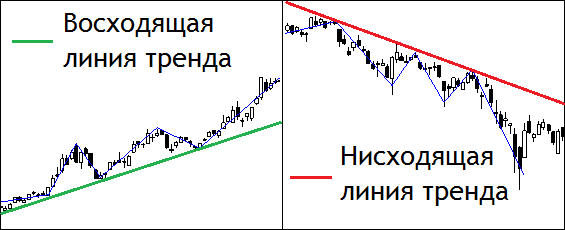
Downtrend Line
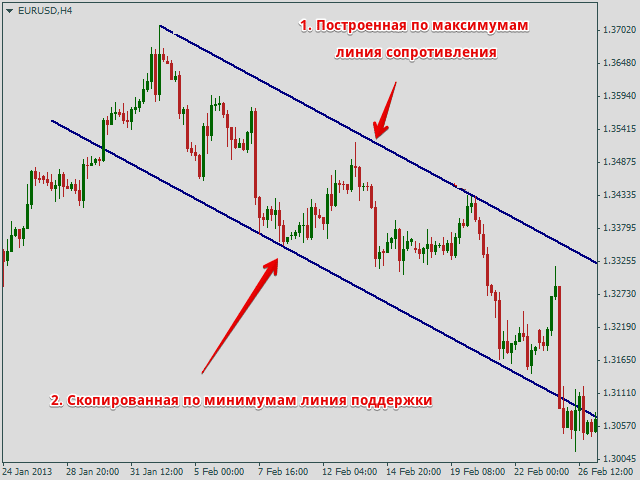
The line is built on the highs on the downward “bearish” chart of changes in market indicators. The straight line is located above the chart and is called the resistance line. The “bounce” points characterize the stability in the trend on the selected timeframe. For flat, the straight line is horizontal and reflects the “stagnation” in the market in the period under review. Note! Building a trend line is easy to work out in practice. To do this, you can use the data of past periods. The forecast is easy to compare with the real picture of what happened, to identify errors and correct the results of the analysis. Examples of trend lines construction can be seen in the next video. https://youtu.be/ZVrjfyNO-r0 The acquired skills in building trend lines will increase the efficiency of a trader’s activity and reduce the risks of transactions.
What can be determined from the trend line?
The constructed trend line will help determine the duration of a stable state of the market, based on the following system of indicators:
- The time scale reflects the degree of importance of the constructed line . The longer the time interval, the higher the reliability of the forecast. The trend identified on the daily chart reflects a more stable and reliable process than the hourly trend.
- Duration shows the situation on the market and the attitude of traders to the trading process . The longer the trend line, the more likely the trend of the process will continue.
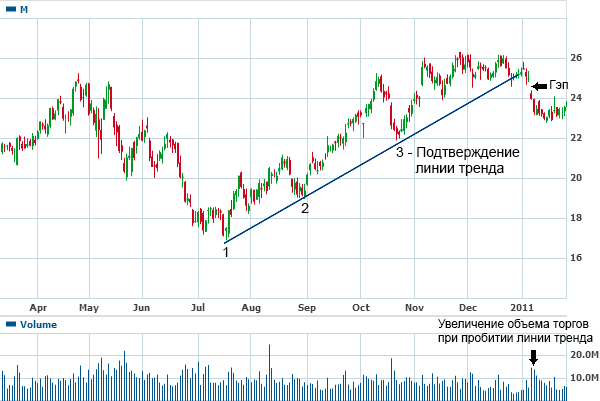
- The number of touches makes it possible to judge the reliability of the trend forecast . A straight line with three or more “bounces” gives greater protection against breaking through the trend.
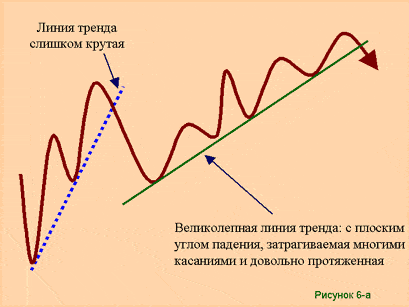
- The angle of inclination focuses attention on the strength of the trend . The steeper the straight line, the stronger the trend. However, too much tilt creates the possibility of a reversal in the market.
What will tell the trend line at the auction
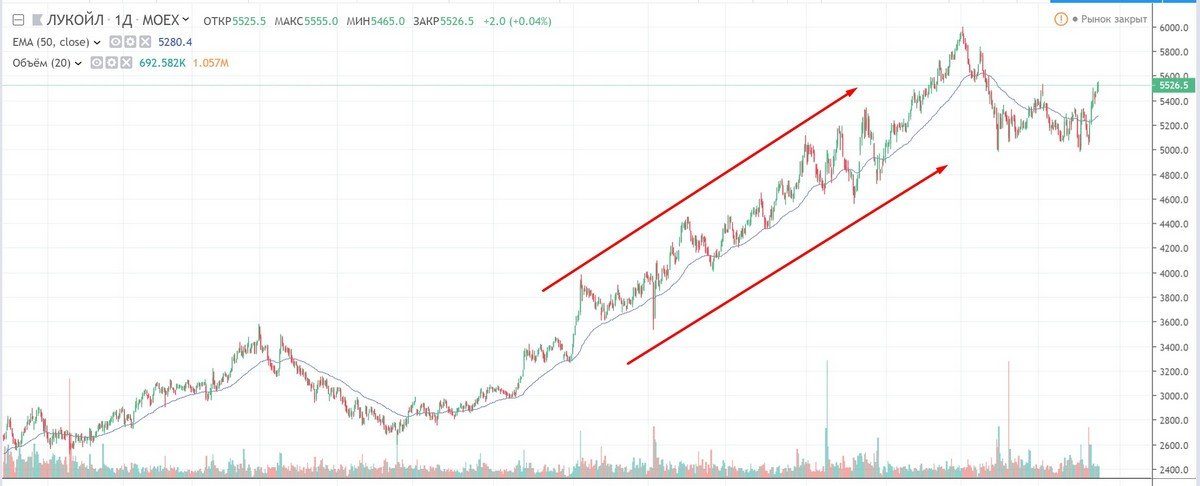
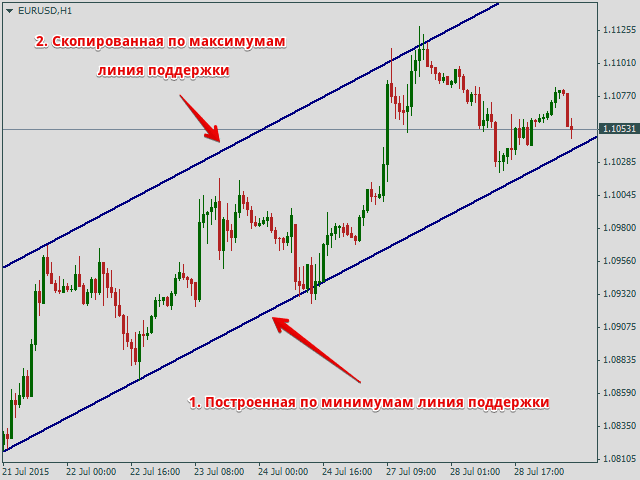
The analysis of the constructed lines provides information on the frequency of changes in the prices of financial assets and the available prospects. Based on the received data, you can build or correct actions at the auction. With downtrends in the long term, one of the decisions is possible: either reduce costs and freeze open positions, or (if funds are available) buy assets. The second solution requires a special approach and is implemented through a trend strategy. With an ascending trend line, it is necessary to sell assets or fix open positions. For a rational choice of actions, participants in exchange trading build a trend channel. For the chart, a support line and a resistance line are drawn simultaneously, regardless of the type of trend. The graphical representation provides complete information about the prices within which transactions can be made.
What is a market reversal and how to see it
No process behaves the same in the long run. The trend line reflects this by a change in monotony – a reversal. A timely forecast of a reversal in trading allows you to reduce your own risks. To determine a potential reversal, you need to pay attention to the price action. Before a reversal after a clearly defined downtrend or uptrend, the change in the price of an asset seems to slow down, i.e. each subsequent extremum (maximum or minimum) differs insignificantly from the previous one. In this case, the combination of impulses and corrections can form reversal patterns:
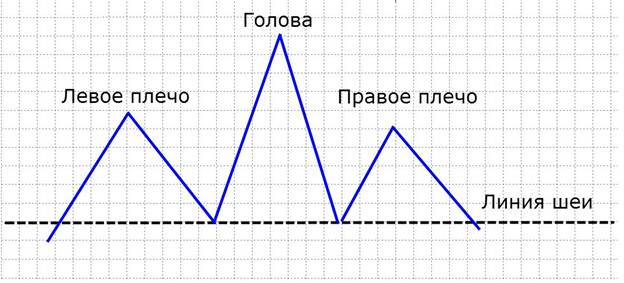
- “head and shoulders”: three peaks, the middle of which is slightly higher (head);
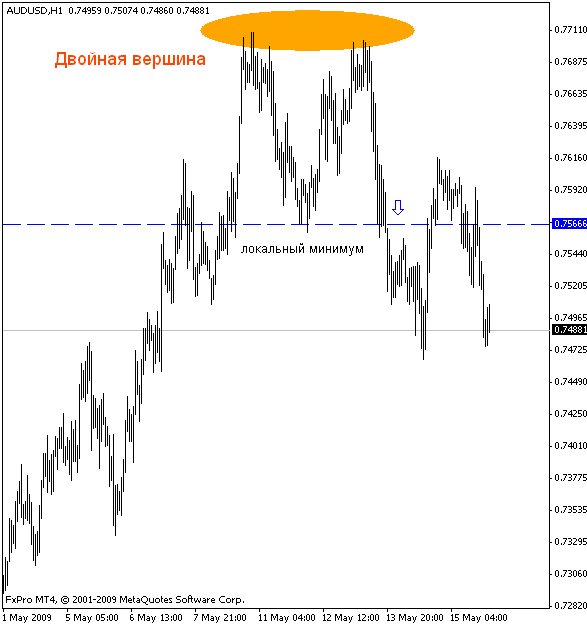
- “double top with a maximum at the same height”;
- “double top with the second top higher than the first.”
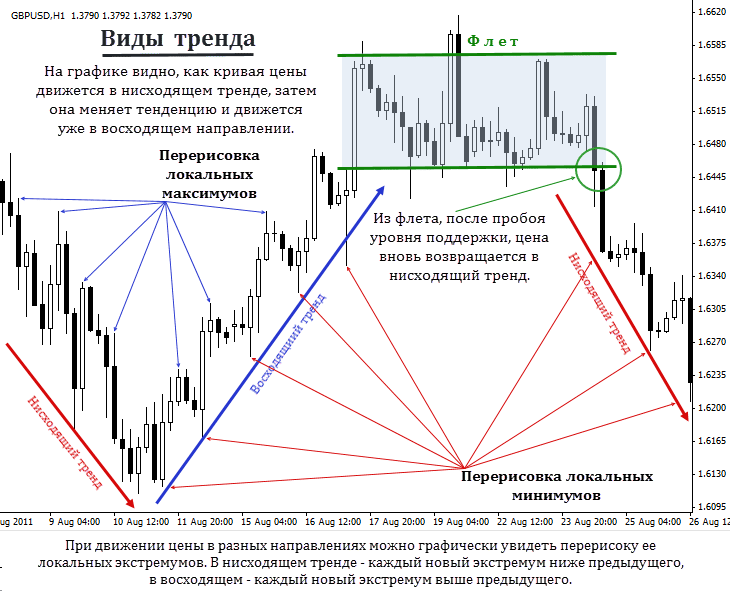
IMPORTANT! A candlestick pattern on a chart is a reversal pattern if it is broken by a trendline. Also, do not confuse a reversal with a small chaotic price change.
Examples of trend line analysis and reversal detection when trading various assets can be seen in the video below: https://youtu.be/cY6ntEusVj8
What trading strategies are built along the trend line?
The following can be distinguished as successful strategies along the trend line without the use of additional stock indicators:
Trend Entry Strategy
When building a strategy, it is necessary to determine the beginning of a trend with maximum accuracy and enter the auction. This is especially important in a strong trend, when the correction is too weak or practically absent. Rollbacks in such a trend are also unlikely.
Rollback strategy
A rollback or short-term price change against the trend is clearly visible in weak trends. Entry into the auction occurs precisely during the rollback period. At the same time, bidders both with an uptrend and a downtrend receive a good risk-to-reward ratio.
