Harami – Japanese candlesticks that form a stable pattern, which is usually considered a secondary tool in the analysis of a trend reversal. However, they are important when reading price charts, volumes and help make more effective trading decisions. Harami Japanese candlesticks are of two types: 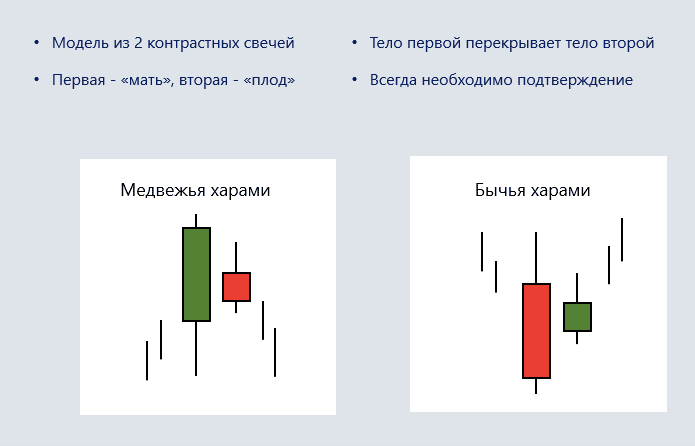
The concept of the Harami pattern
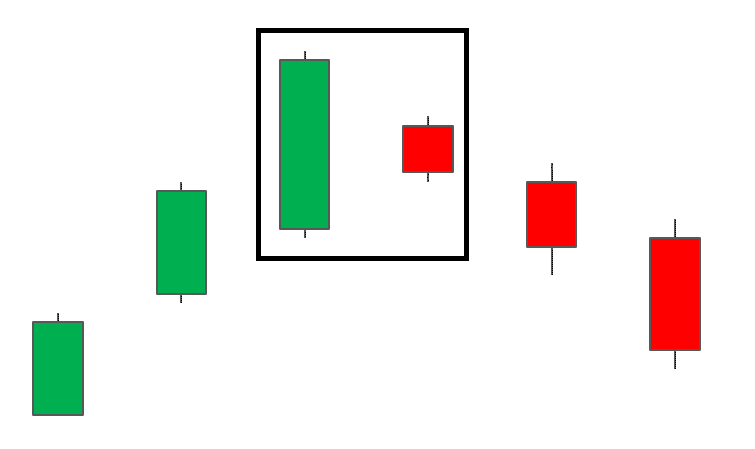
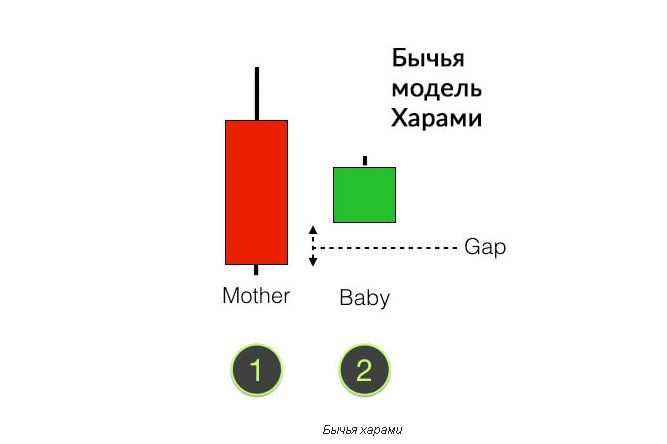
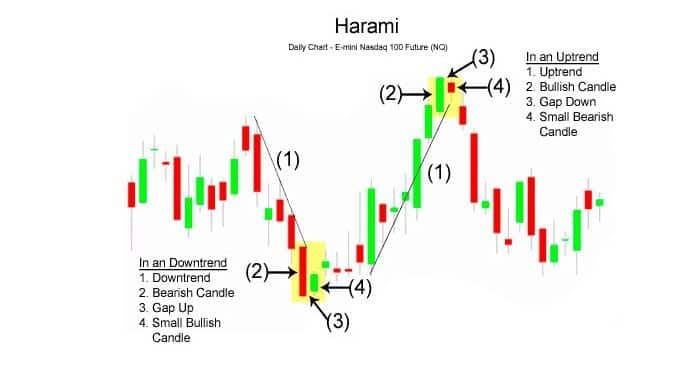
Harami is a pattern consisting of 2 consecutive Japanese candlesticks. The first is the largest, the second has a small body that does not go beyond the range of the body of the previous one. The elements are opposite in color. When a Harami pattern appears on the chart, a trend reversal is possible.
The word “harami” is translated from Japanese as “pregnant”. This reflects the essence of the pattern: the body of the second candle does not go beyond the body of the first.
The candlestick pattern on the charts shows the indecision of the market. At the moment of formation of the figure, there is a confrontation between the “bulls” and “bears”. To understand which side will win, you need to use additional tools: accompanying patterns and indicators. There are several mandatory conditions that allow you to identify the pattern:
- there is a clearly expressed prevailing trend (upward or downward);
- the first Harami candle formed in the direction of the current trend;
- the body of the second candle is completely within the range of the body of the first;
- the body of the second element is colored opposite to the first.
If at least one condition is not met, then the figure cannot be considered “Harami”. At the same time, it should be taken into account that a strong combination contains a small second candle, the size of which is no more than 25% of the length of the “mother” element.
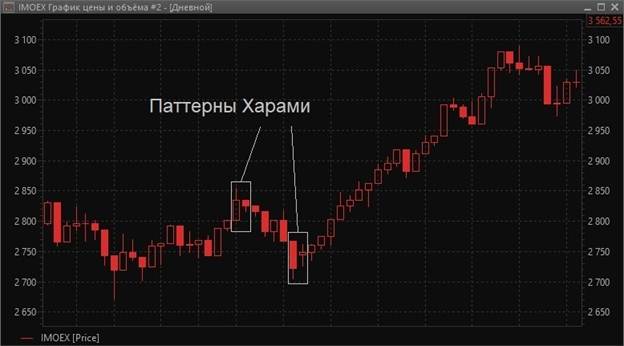
Harami types
There are 2 types of Harami patterns: bullish and bearish. The bullish Harami serves as an indicator showing a high probability that the downtrend is ending. When forming this figure, many investors prefer to open long positions on the asset with the expectation of profiting from the expected growth. Unlike bullish, bearish Harami indicates the possibility of an uptrend reversal. At the same time, it is believed that the size of the second candle determines the strength of the model: the smaller it is, the higher the probability of a change in the main trend.
Cross Harami
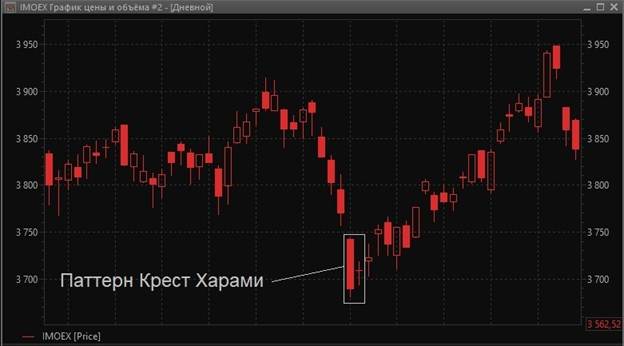
A trading harami cross is a pattern consisting of a large candle moving in the direction of the prevailing trend followed by a small doji. In this case, the second element is contained in the body of the first. The second Japanese Harami Cross candlestick is also called an inside bar.
Doji (doji) is a candle, the body of which is extremely small due to the equality of opening and closing prices. It looks like a cross, an inverted cross, or a plus sign. It is a neutral pattern, but as part of some figures it can signal upcoming changes in the market.
The psychology behind the formation of the Harami Cross is similar to the formation of the standard Harami pattern. The Harami Cross pattern can also be bullish or bearish. In the first case, it signals a possible price reversal upwards, in the second, a change in the uptrend.
Analysis and application in practical trading
The figure can be used as a standalone analysis tool. To make buying or selling decisions, sometimes it is enough to understand the psychology of pattern formation. When forming a bullish pattern, the following algorithm is used:
- Aggressively buying an asset after the price rises above the high of the second Harami element. In this case, the “stop” is fixed at the level of the minimum of the first bearish candle. The probability of working out the pattern is slightly reduced, but a favorable Stop Loss / Take Profit ratio is obtained.
- Conservative buys are made when the price rises above the high of the first candle. The lower extremum is taken as the level for Stop Loss.
- When choosing the moment to complete the transaction, they are guided by Fibonacci retracement levels , built on the basis of the previous downtrend.
When forming a bearish pattern, they trade according to the following algorithm:
- They aggressively sell the asset when the price goes below the low of the small candle of the pattern. Stop Loss is set at the upper extremum of the first Harami element.
- Conservative sales are carried out when quotes fall below the low of the first candle, while Stop Loss is set at its maximum.
- When choosing the moment to exit a trade, it is analyzed for Fibonacci retracement levels built on the basis of the previous uptrend.
Strategies using additional tools
The candlestick pattern “Harami” in trading is considered secondary. However, in combination with various indicators, it can play an important role in making an effective trading decision.
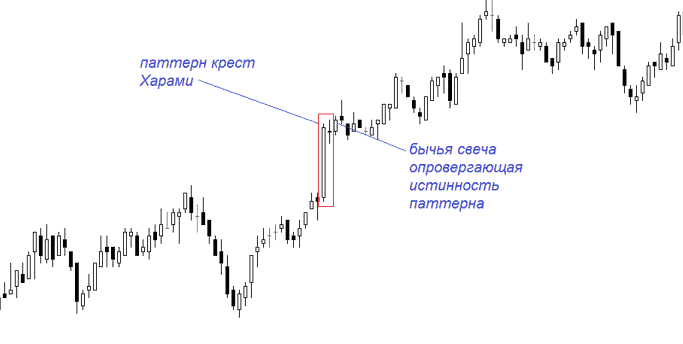
- Analysis of Harami and Price Action . Price Action analysis (price behavior) is used to confirm or refute the strength of the formed figure. Carefully study the chart, trying to find additional patterns.
- Pattern combination with EMA and Fibonacci levels . An exponential moving average is used to determine the entry point into the market. When the price moves in the expected direction, Fibonacci levels are constantly analyzed. The position is closed when quotes break through a key support level or EMA crosses the direction of the main trend.
- Trading with the Fast Stochastic Oscillator . The fast stochastic oscillator helps to estimate the probability of forming a strong pattern. For example, an expected reversal of an uptrend or downtrend is often confirmed by a “stochastic” signal about an asset being oversold or oversold, respectively.
- Application of Bollinger Bands . A trader opens a position if the price touches the upper or lower border of the indicator band. For example, when the price reaches the upper level, a short position is opened. Hold it until the quotes approach the lower border of the band.

