The STANDARD & POOR’S 500 Index (S&P 500) is one of the world’s most popular and well-known stock indices. It can be put on a par with the Dow Jones index. On October 29, 2021, the index reached its all-time high, so its prospects are quite good.
What is the S&P 500
The abbreviation “S&P 500” refers to the stock market index. At this point in time, he tracks the stocks of 500 US companies. All of them are distinguished by a large degree of capitalization. Thanks to the SP500, you can track the performance of the stock market. It will also report on the risks and returns of the largest companies. The index is often used by investors as a benchmark for the entire market. It is compared with all other types of investments. As of 2021, the index has an average return of around 13% per year. In October of this year, it reached its historical maximum. At this time, the value of the intraday high and the maximum close was 4,608.08. 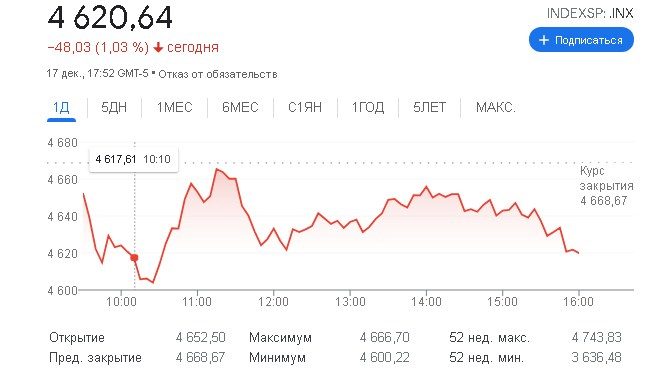
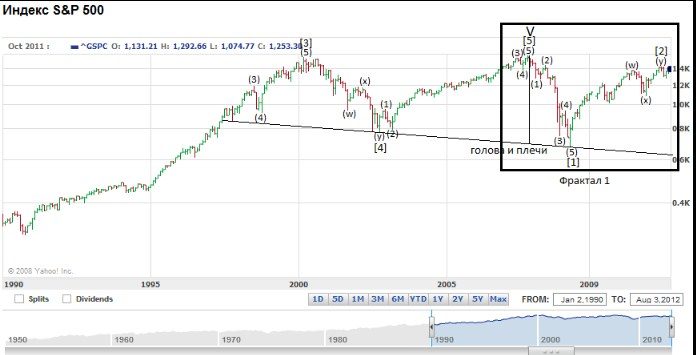
What is included in the S&P 500 Index
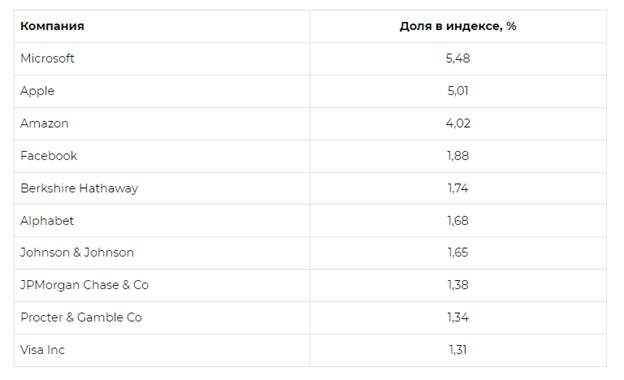
The index is compiled as follows. The 500 largest US companies by capitalization are taken into account. However, there are a number of nuances here. For example, when calculating, only those volumes of capitalization that have free circulation on the market (at least 50% of shares) are taken into account. Private companies and those organizations whose shares cannot be purchased on the stock market are not taken into account. In addition, the shares included in the index must be distinguished by their liquidity. In other words, it should be possible to buy or sell shares at any time. The composition of the S&P 500 is reviewed every quarter. The changes mainly concern:
- inclusion and exclusion of certain companies from the index;
- decrease or increase in the share of the organization’s shares in the index;
At the moment, the main current composition of the S&P 500 looks something like this: [caption id="attachment_7709" align="aligncenter" width="624"]
How the S&P 500 works
The S&P 500 carefully monitors the market capitalization of the companies that make up the index. The term “market capitalization” here refers to the total value of the shares that are issued by the company. It is easy to calculate it. It is enough to multiply the number of shares that the company issues by their number. For example, if an organization has a market capitalization of $100 billion, it will earn 10 times the profits of a company with a market capitalization of $10 billion.
As of 2021, the total market capitalization of the S&P 500 is about $27.5 trillion.
It should not be forgotten that the index only measures public stocks. It does not take into account those securities that belong to control groups, other companies or government agencies. To be included in the index, a company must be located in the United States of America and have a market capitalization of at least $8.2 billion. At the same time, at least 50% of its shares must be available to the general public. Securities must sell for at least $1 each. The last four quarters before entering the index, the organization must have only positive profits. At the same time, analysts are required to confirm that, according to forecasts, this trend should continue over the next several years. According to 2021 data, the breakdown by sector of the S&P 500 included the following values:
- Information technology: 27.5%;
- Healthcare: 14.6%;
- Consumer services: 11.2%;
- Communication services: 10.9%;
- Finance: 9.9%;
- Industry: 7.9%;
- Consumer goods: 7.0%;
- Utilities: 3.1%;
- Real estate: 2.8%;
- Materials: 2.6%;
- Energy: 2.5%.
Graphs and explanations
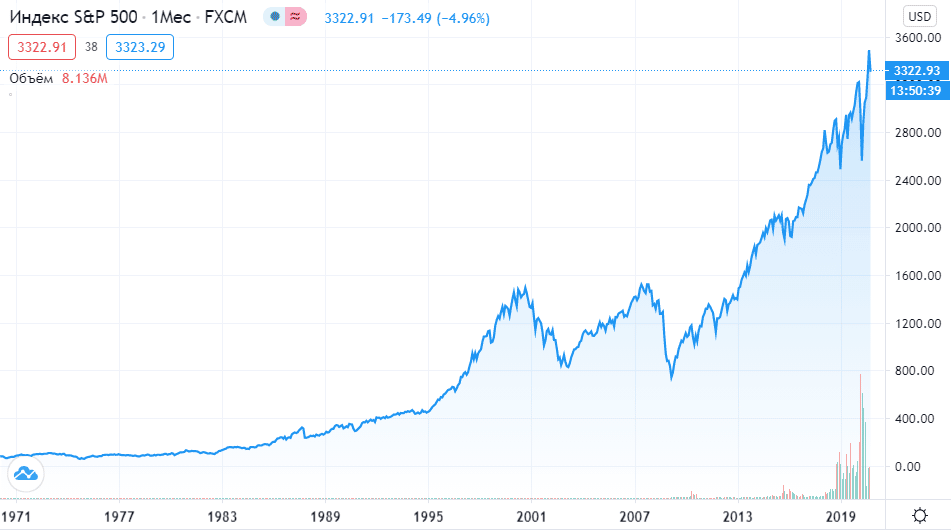
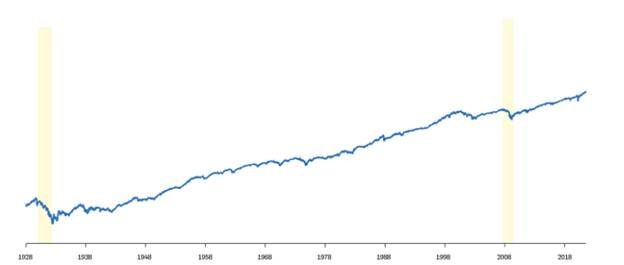
The index maintains its positive growth trend, even despite the economic crisis caused by the pandemic. 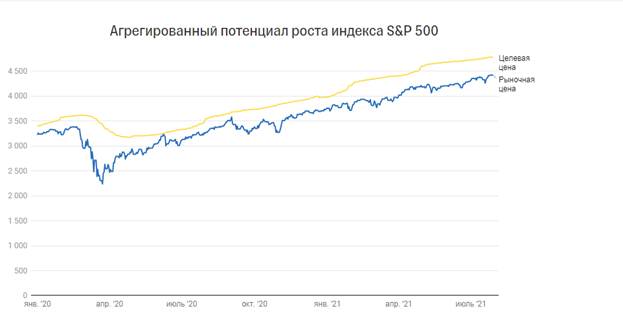
How to make money with the S&P 500
The average citizen of the Russian Federation will not be able to directly invest in the S&P 500. This is due to the policy that the owners of the index strictly adhere to. However, a person can mimic its performance with an index fund. In addition, citizens of the Russian Federation can simply buy shares of companies that are part of the S&P 500. They will also bring good income. Many investors use the S&P 500 as an economic indicator. The fact is that the US economy is distinguished by its stability. Therefore, the companies included in the index, located in the territory of this country, are distinguished by their reliability and prospects. This gives investors confidence in the value of the shares they buy from these organizations. Since the S&P 500 only measures US stocks, investors are advised not to forget about the markets of other countries. In recent years, China and India have good prospects for further development. Perhaps it makes sense to periodically buy securities that are owned by companies located names in this region. Investing for beginners in the S&P 500 index – how to invest in the index SP: https://youtu.be/ZJrL75jL6rM Some analysts suggest that in the future, in a few years, China and India stocks may reach the same position as US stocks. More optimistic forecasters believe that the securities will even manage to outperform them. However, these are all just predictions and assumptions that do not have a solid foundation. However, they should not be ignored. In the next few years, the economic situation in the world may change dramatically.
S&P 500 Trading Strategies
There are dozens of trading strategies associated with this index. Here, traders use the full range of existing methods, from scalping to long-term investments. However, apart from other methods, there is a method that involves the conclusion of transactions aimed at convergence or divergence of the spread between the S&P 500 and other types of indices, or stocks. Formally, this is one of the types of pair trading, which refers to hedging.
Key takeaways from the S&P 500
- Most investors have long known that owning the S&P 500, or a portion of the stocks it owns, is a good way to diversify your stocks. This is primarily due to the fact that the index currently covers most of the stock market.
- However, sometimes there is a threat of falling even the most reliable units of the stock market. In this case, traders prefer to open short positions.
- In the S&P 500, a short position here can be represented in a variety of ways, ranging from selling the S&P 500 ETF to buying put options on the index or selling futures.
What is the S&P 500, how to invest in the SnP 500 index, Warren Buffett’s opinion on the S&P index: https://youtu.be/OFRNvRaguoE money. To do this, you will need to buy shares of organizations that are included in the index. The S&P 500 has good growth prospects, which provides a person who has acquired securities with stability and in the long term an increase in their income from shares.
