The technical analysis head and shoulders figure in trading – what it looks like, plotting on the chart, trading strategies. The head and shoulders pattern is familiar to everyone who trades. It belongs to the category of classical, therefore, necessary for study. It is from her that acquaintance with the world of charts and technical analysis begins, which is an integral element of the type of activity in question. The figure allows using its example to consider the properties and characteristics that will be present to one degree or another in other various patterns, constructions and forms used in trading.
- What is the head and shoulders pattern, and what is the meaning of the pattern
- Why is this pattern formed?
- Features of pattern formation
- How to use, trading strategies based on the head and shoulders pattern
- How to enter on the breakdown of the neckline?
- Setting a stop loss
- How to fix profit
- Reversed Head and Shoulders
- A few examples of the Head and Shoulders pattern
- Key Rules
- When to use the GUI, and vice versa when not to
- Pros and cons of using a figure
What is the head and shoulders pattern, and what is the meaning of the pattern
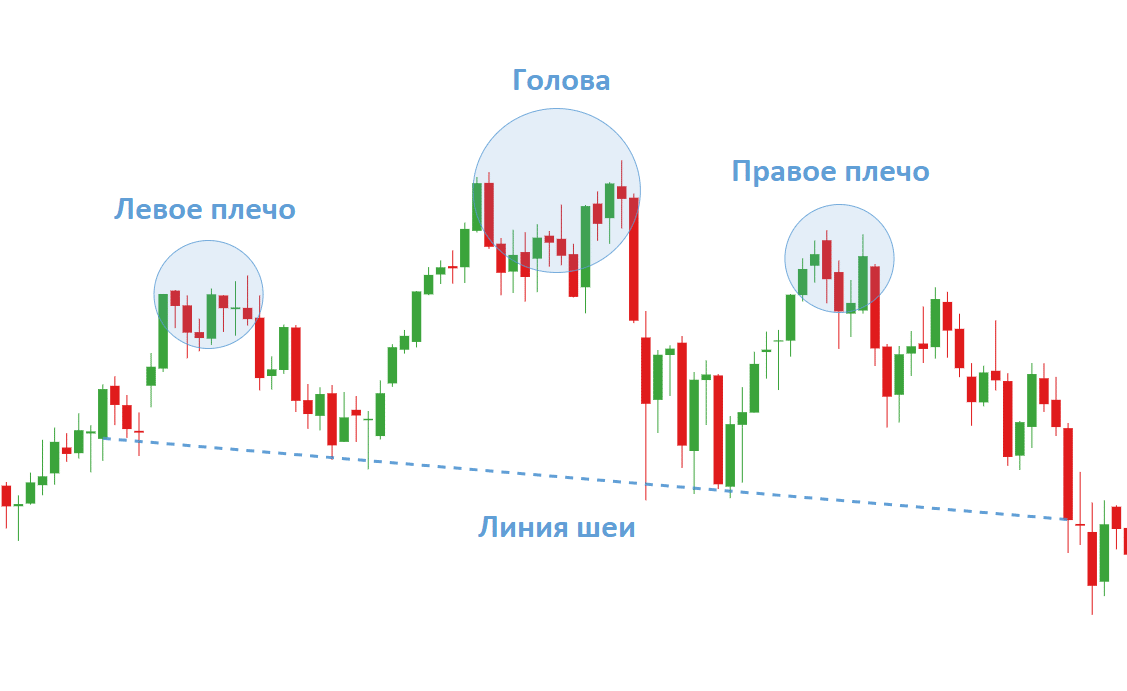
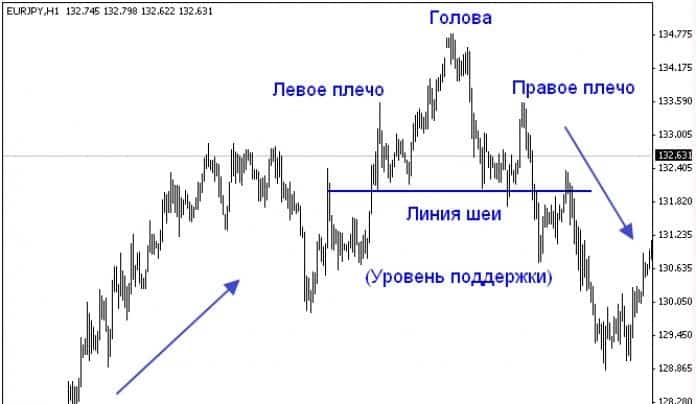
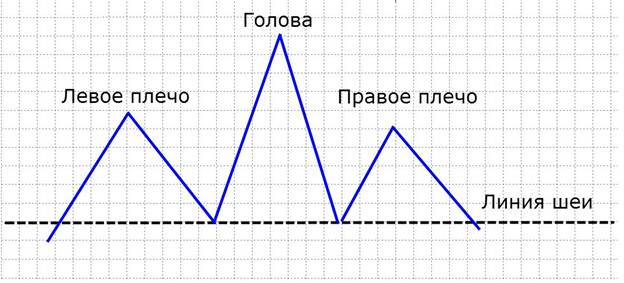
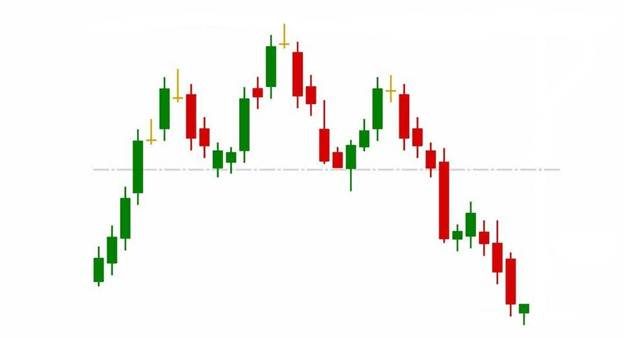
The head and shoulders or HIP in trading is the main (classic) figure. It bears a similar name at the moment of an uptrend. If it is falling, then the name will change – an addition “inverted” head and shoulders figure will appear. The figure also applies to reversal. Its appearance should attract attention, since the figure indicates that at some point there was a break in the existing trend. Optional: indicates the likely price movement in the opposite direction. The GUI consists of 3 parts when viewed on a graph:
- Left shoulder.
- Right shoulder.
- Head.
It is actively used by specialists to accurately predict trend reversals. Acceptable for bull and bear markets. This is how it looks visually:
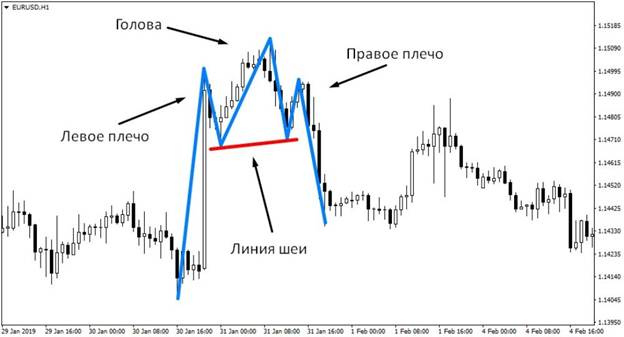
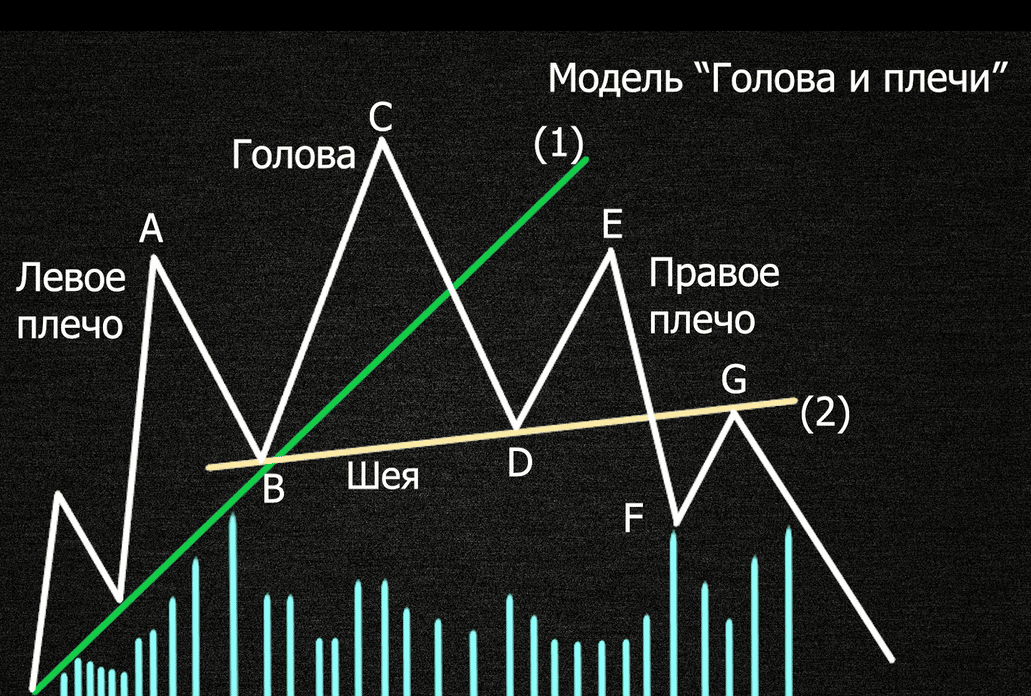
- Uptrend.
- Left shoulder.
- Head.
- Right shoulder.
- Neck line.
The neck line is not accidentally indicated last. To correctly assess what is happening, you first need to see and fix how the shoulders and head appear. Only after them can you start determining the neck line on the chart. This approach reduces the likelihood of errors by several times.
Why is this pattern formed?
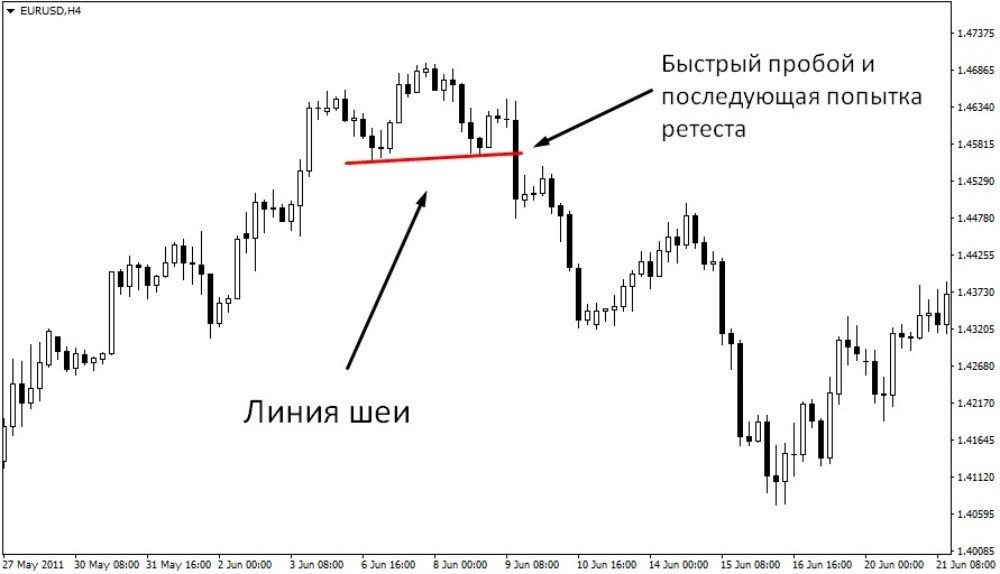
The key head and shoulders pattern is a classic reversal pattern. The appearance signals that the previously existing faith of buyers in the prevailing trend in trading and in the market has disappeared. The right shoulder is a hint for a trader, since a decreasing peak on the created chart indicates the fact of a slowdown in the trend, an increase in the likelihood of a reversal. We must not forget that any, even a slight price movement is immediately reflected on the chart, and also largely carries a certain message for bidders. The important information for the trader is that the buying power is ending. At this point, you should start preparing for a turn. It occurs because the existing price structure causes the market to change the previously chosen direction. Along with it, sellers and buyers are forced to move. The main sign of a change in trend, which should occur in the near future, is the change of successively higher highs and lows. They, respectively, appear on the charts. At the same time, the current trend in the technical sense has no violations. This will continue until a lower high and a lower low are noticeable. You need to compare with those indicators that were previously. The figure is actively working due to a change in the price structure of the formed uptrend. This feature indicates and signals that it is necessary to continuously monitor the change of highs and lows of the price movement. The formation is also considered as an element for confirmation only after the breakdown of the neck line. It is commonly understood as closing the price below the level. Important to remember, that the figure cannot be considered complete when the right shoulder is formed. This element is only complete when the price closes below the neck line. To confirm the breakout, the price closed below the neck level. 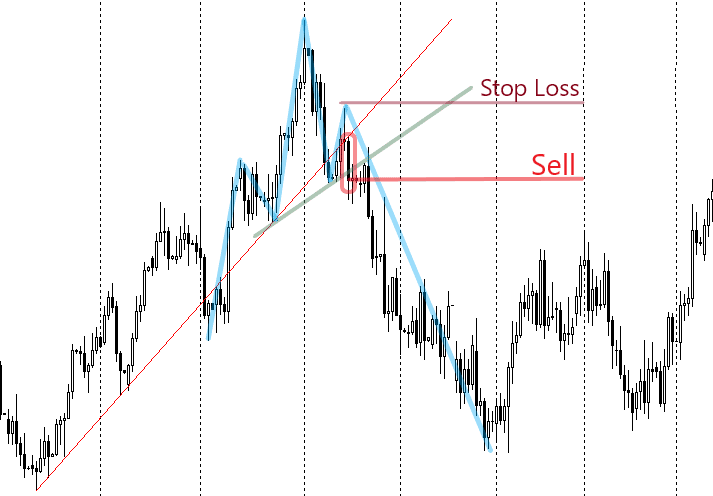
Features of pattern formation
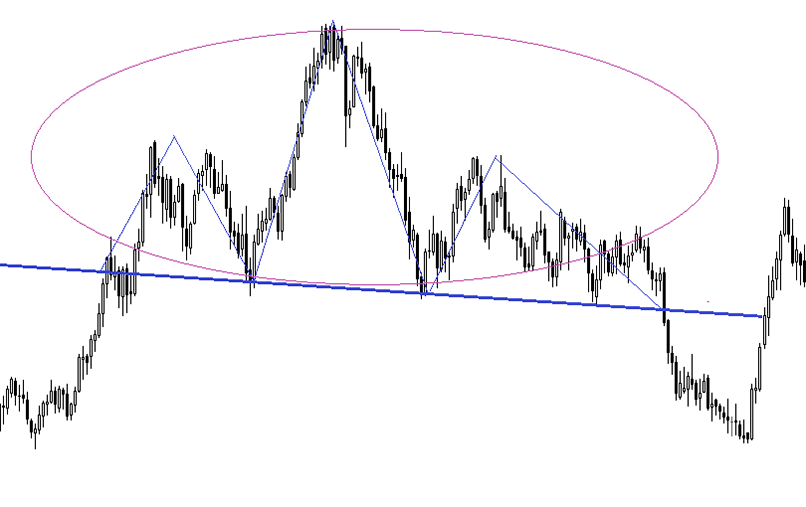
Considering the features, it should be noted that the first sign indicating the appearance of a reversal pattern is the designation of the bottom after the formation of the head. In the case of the formation of a bottom trend, then in 90% of cases a slowdown in intensity should be expected. After that, the formation of the GUI will begin on the chart. There is a situation when 2 peaks appear on the chart, they grow. At the same time, the bottom created after the formation of the head breaks the line of the previously existing trend. A similar phenomenon is an impulse to slow down. At the next stage, the formation of the head is completed. After that, you can immediately prepare for the fact that the third peak will appear. In some cases, at this moment, the price may test the previously broken trend line for resistance. The neck is an important component. The neck line is the defining trigger for the need to enter the market. To designate the laziness of the neck, it is required to designate 2 bases. The first will be the bottom (formed immediately before the formation of the head) and the bottom, which appears immediately after the formation of the head. For designation on the graph, it will be necessary to connect the points under consideration with one line. It can be straight (horizontal) or inclined. The head and shoulders pattern – a complete guide: https://youtu.be/dooSwg2pLSQ
How to use, trading strategies based on the head and shoulders pattern
The received signals should not only be recognized, but also applied in the trading strategy. It is important to understand that the head and shoulders is a reversal pattern, which in 90% of cases is not holistic. This means that there may be some interference between the structures.
How to enter on the breakdown of the neckline?
This is a kind of signal that traders need to open a deal. At this stage, you need to see and fix the moment when the price starts to break through the neck line. There are 4 methods for this:
- The use of a stop order, which is used to place a position below the neck line.
- Wait for re-testing, and then enter the market.
- Accelerate the deal until the figure is formed.
- Use multiple timeframes to get the highest probability of a trade setup.
Each of the methods requires maximum attention to detail and the situation as a whole.
Setting a stop loss
You can put a stop above the right shoulder. This will lead other participants to choose a more aggressive placement with a high degree of probability. You can also place it above the level of the last pullback. Another method suggests that it is produced above the neck line.
How to fix profit
There are several approaches for this purpose:
- You need to take profit at the nearest key support level. The chart needs to be monitored for a strong price rebound.
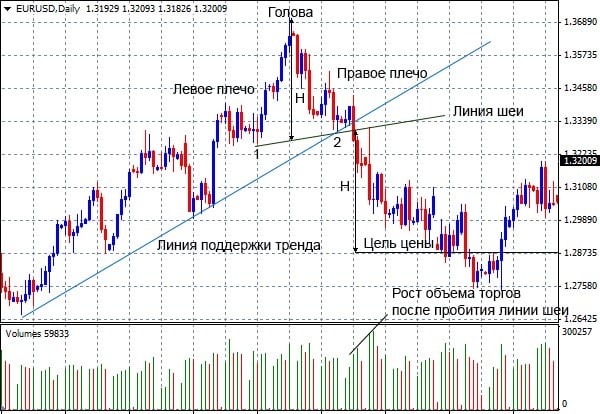
- Using price movement distance measurements. The figure’s height value is evaluated.
- Using the trailing stop technique.
In each of these methods, there is a real chance of profitable profit taking.
Reversed Head and Shoulders
It should be borne in mind that the hip pattern in trading can be inverted. In this case, the pattern is formed during a bearish trend. Indicates a trend reversal with a probability of 90%.
A few examples of the Head and Shoulders pattern
Here you can see an inverted figure. The situation indicates that a reversal has occurred. It is important to pay close attention to the indicators in order to maintain profits.


Key Rules
Basics to remember and use:
- The figure should form after an uptrend.
- The shoulders cannot (and should not) be higher than the head.
- The slope of the neck line cannot be downward. Its optimal positions are ascending or horizontal.
Compliance with these rules will allow you to receive guaranteed profit and fix it in a timely manner. The chart may start with a bullish trend. The figure under consideration will gradually begin to form (according to the indicated principles). After defining the model, you can begin to designate the neck line (on the chart – a horizontal line). A short position is open (the candle closes below the line). The stop loss must be placed above the second shoulder.
When to use the GUI, and vice versa when not to
You should start using the figure at the stage of familiarization and training in trading. If the trades become large, then it is better to refuse to use such a figure. The reason is that the charts will be visible to all traders at once, which threatens to lose profits.
Pros and cons of using a figure
The advantages include ease of perception and the ability to quickly assimilate nuances. Tracking changes using this shape is also not difficult. Also pluses: various signals that allow you to navigate the price position, learn about the depletion of the market and take profits in a timely manner. Minus – experienced traders will be able to quickly read important information and quickly enter the market with maximum profit. It is believed that QUIK and MetaTrader terminals are basic and convenient. Their high popularity is due to the fact that they provide traders with all the necessary trading features that allow them to quickly develop, improve and make guaranteed profits. The figure of the GUI in them is seen most clearly. The functionality allows you to quickly capture changes and display them on a chart.
