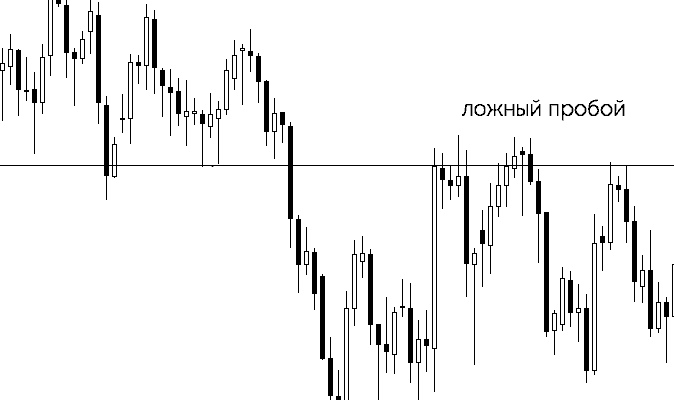
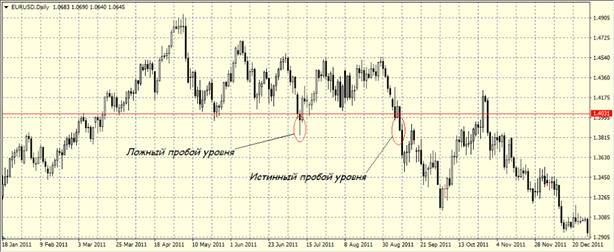
What is a false breakout in trading and how to distinguish it from a true breakout, how to identify it on a chart. False breakouts in trading carry the same meaning as their sound. It was the breakout that failed to go beyond the level that led to the misconception about what was going on. False breakout patterns are one of the most important price action trading patterns because a false gap is often a very strong indication that the price may be moving or that the trend may be resuming soon.
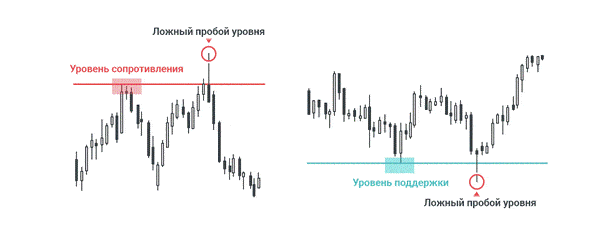
Additional Information! This pattern can also be seen by traders as an entry into a trade in the opposite direction of the breakout attempt. In such a case, since the attempt failed, the price may go in the other direction. A false breakdown is also called a “Failed Break” in the US, that is, a deceptive breakthrough.
How are false breakouts formed?
There is an opinion that a breakout can be provoked by a major player. Thanks to a false breakdown, conditions begin to form under which many people want to buy an asset from a major player, or sell it to him. Due to the fact that most players will start taking losses, sensing a fall, the market will begin to fall even more rapidly. Accordingly, the market will fall due to its own gravity. That is, there is a possibility that the false breakout is an artificial “big fish” maneuver in the trading ocean based on the behavior of the masses.
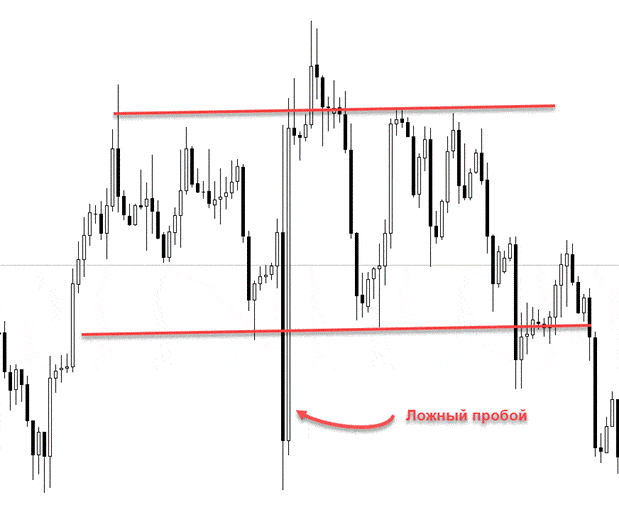
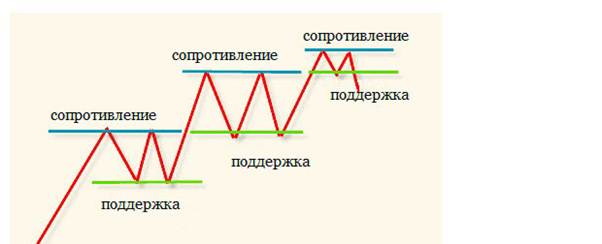
resistance and support zones. These areas can be based on trendlines – horizontal or diagonal highs, or lows in price, or charts drawn on a chart. A failed breakout shows that there was not enough buying interest to keep pushing the price above resistance or below support. After a failed breakout, short-term traders may abandon their position if they are hoping for a breakout.
How to find false breakout patterns?
The types of breakout patterns are divided into several categories, these include the following types, which are most common among traders:
- Diagrams . Chart templates are a common type of breakout. Chart patterns include triangles , wedges , channels, rectangles , head and shoulders , cup and handle , and expanding ranges. These patterns occur when the price moves in a certain way. A trader usually draws trends on a template to indicate where the support/resistance levels are. When the price breaks out of the pattern, they enter the direction of the breakout.
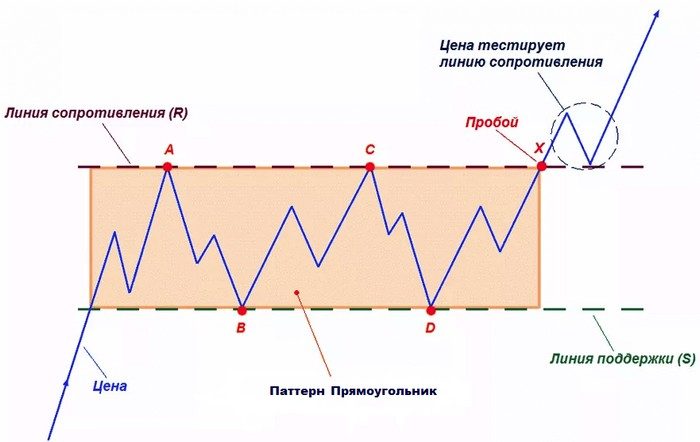
Trading rectangle - Technical indicator . The technical indicator works in a similar way and can even form some of the same patterns mentioned above. For example, the Relative Strength Index (RSI) indicator may form a triangular pattern. If the price breaks out of this triangle for the better, it could be a signal to buy, or if it breaks lower to sell.
In addition to these patterns, traders manage to find others. You need to constantly follow the news in the world of trading and keep yourself up to date.
The dangers of trading on a false breakout
The main danger of a false breakdown is for beginners. When a person is just starting to trade, the breakout strategy becomes the main way of playing for him. Whether it’s a breakout from a range, or another pattern – like a triangle, or just a little price consolidation – the idea behind this tactic is to capture a big move by following a pattern that’s easy to spot. You can learn more about level breakouts in trading
in the article . 
Important! Trade breakouts can work, but one must be prepared to experience many false breakouts. If you learn too slowly, then disappointments will haunt you more and more often.
How not to fall into the trap of false breakouts
There are methods that allow you to save yourself from mistakes. However, no one has the right to guarantee 100% probability. In order not to fall into the trap of false breakouts, you need to have an understanding of the patterns that were described above. There are basic concepts and rules of behavior in the exchange market. The ability to avoid erroneous actions guarantees success in bidding. There are the following mistakes of every beginner:
- Inappropriate market research. You need to devote a lot of time to studying the mechanics of trading.
- Trading without a plan. Having a plan is a must for successful coaches.
- Overdependence on software.
- Failure to cut losses.
- Position inflation.
- Portfolio exhausted too quickly.
- Misunderstanding of pressure levers.
- Misunderstanding of the relationship between risk and reward.
- Overconfidence after making a profit. Too many beginners begin to believe that money is very easy to earn every time, because of this they lose everything.
- The influence of emotions on decision making. Sometimes, after a failure, many try to recoup, which drives themselves into debt even more.
Most of these mistakes are inextricably linked to hitting a false breakout. That is why you should carefully study them and memorize them.
Why is emotional trading on false breakouts dangerous?
Emotional trading is equally dangerous in all situations encountered in trading. False breakouts, like all other dangers, do not forgive mistakes. It is worth understanding what the concept of trading on emotions is.
Emotional trading is when a trader or investor allows personal feelings and emotions to influence decision making. This can sometimes be helpful, but usually bringing emotion into a trade is a bad idea.
Most traders would agree that emotional control is one of the most important traits in the investment world. The first thing a trader or investor needs to know is how to identify the signs of this:
- Panic when selling a stock, due to the loss of a few points, is one of the signs.
- Get hung up on falling stocks because he is afraid to lose everything, etc.
- Hiding from price updates due to fear of loss is the third sign.
- Trading without a stop loss is the fourth.
Emotional trading usually involves abandoning a strategy. If you understand this in time, then you can stop yourself. Removing emotions from trading is not easy. Emotional trading is similar to the confirmation trend, a psychological trend that influences trading without even realizing it, and is an aspect of behavioral finance, the tendency to make irrational financial decisions. Traders who have an investment strategy should follow it and never make decisions based on emotions or feelings. Naturally, the main danger in emotional trading on false breakouts is the loss of money and subsequent mistakes against the background of emotions.
Trading strategies for a false level breakout – what can be offered in practice?
Despite the difficulties, there are several ways to make money on situations with a false breakdown. In order to trade professionally with a false breakout, you need to monitor the following conditions that may arise:
- Crossing the trend line from top to bottom and fixing in a certain position . You need to place an order aimed at increasing, above the breakout high point, which was the first. In this case, a position will open when the chart crosses the trend line from bottom to top.
- Chart crossing a trend line from bottom to top and fixing in a price channel of a narrow type . In this case, you should place an order below the low of the price of the pattern that was first broken. In this case, the deal will be opened when the chart returns to the original price range.
- The chart crosses the overbought area in the upward direction and rises above the resistance level . Then, you need to place a sell order slightly lower than the low of the breakout pattern. Then a position will be automatically opened and all that remains is to take profit in case of a rapid trend change, or the oversold zone will be reached by the chart.
False breakout trading: https://youtu.be/A0UjsupzZRE There are other trading strategies, in addition, they open and new ones are constantly found. Trading continues to amaze even experienced professionals. Basically, those who can approach this matter with a cool head and patience win.
