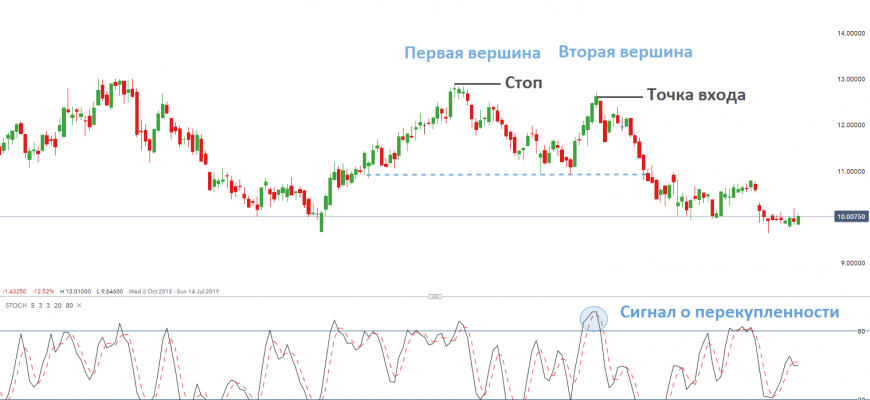
What is a double top in trading, what is the pattern, its description and interpretation of the Double top reversal pattern. In technical analysis, a pattern is a steadily repeating price pattern that determines the market movement in the future. In other words, the pattern suggests whether a certain trend in the market will continue or reverse. There are several types of patterns:
- graphical analysis (figures);
- candlestick analysis (candle combinations);
- fractals;
- statistically significant price models.
https://articles.opexflow.com/analysis-methods-and-tools/svechnye-formacii-v-trajdinge.htm The double top is one of the most common patterns in the graphical analysis of the financial market. Its appearance on the chart in the
trading terminal gives the trader an idea that the price will most likely behave in the same way as when this pattern appeared on the chart earlier. A double top in trading shows the moment of a price trend reversal. The peculiarity of the figure is that it does not have a slope, but has symmetrical tops, it appears as a result of the completion of an uptrend.
- How to identify a double top and calculate Double top on a chart
- Elements of the double top pattern
- Formation of a double top pattern in trading
- Types of double tops in trading
- How is it used in technical analysis?
- Trading on the stock exchange on a double top – practical strategies and examples with descriptions and photo explanations
- Don’t Make This Mistake When Trading the Double Top Pattern
- How to trade the double top pattern and make a profit?
- Reliable Entry Technique
- Pros and cons of the pattern
- Mistakes and risks
How to identify a double top and calculate Double top on a chart
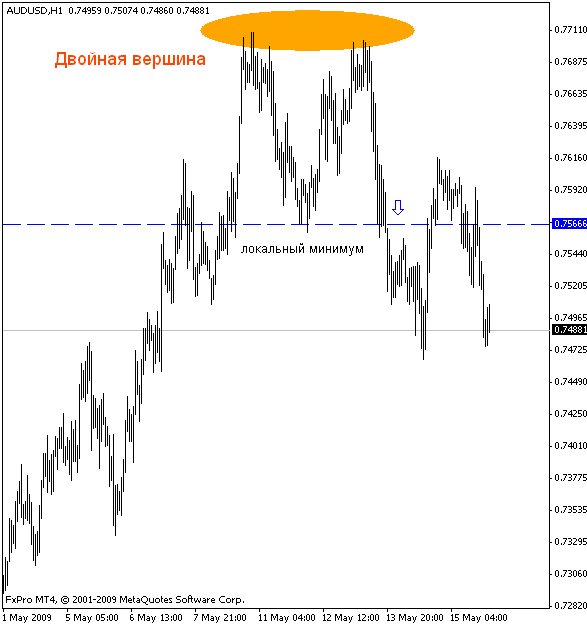
For a more accurate reading of the Double top pattern, you need to know exactly what a double top looks like in technical analysis. Graphically, it looks like the letter M. The double top pattern is formed as a result of an upward trend in price growth to a maximum (A), after which the price reverses sharply and falls to a downward support (B). The subsequent rise in price reaches the level of the previous top A, while there may be a slight fluctuation in one direction or another (A1), while there is no price breakout. The next reversal lowers the price to the previous value B or lower. A price break below level B makes the double top pattern complete and the trend broken. Double top pattern on the chart:
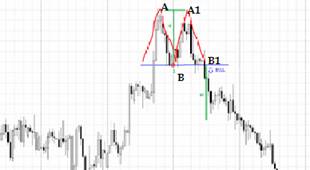
- mark on the graph two peaks having the same width and height;
- the distance between the vertices should not be small;
- indicate the level of support.
To determine the Double top pattern, you can use technical indicators such as the oscillator and
moving averages . Many traders expect a fully formed figure, with a price breakout, as a confirmation of the truth of the trend, to make trades.
Elements of the double top pattern
The double top pattern, as mentioned above, graphically resembles the letter M. The figure consists of two peak peaks located on the same level, and a trough located between two of them. The horizontal line drawn through the low point of the trough forms the support level. The height of the figure provides a guideline for the stock in price. It is defined as the distance from the peak of the pattern to the support line.

Formation of a double top pattern in trading
In trading, a double top is a graphic, reversal pattern and shows a downtrend or uptrend in price. On the charts, this pattern appears when the price reaches the minimum/maximum values, and then reverses sharply and reaches approximately the previous level, where it reverses again and returns ascending/descending to the minimum/maximum values, making another sharp reversal. The final formation of the double top occurs after the price breaks through the support line or the confirmation line.
Types of double tops in trading
In trading, in addition to the ascending double top pattern, there is often a figure opposite to it and is called
a double bottom or double bottom. Graphically, the pattern looks like the letter W and is formed in a downtrend. It is also called a bullish reversal and has the opposite characteristics of a double top. This means that the price reaches its minimum value, after which it rises for a short period of time and again rolls down to the minimum value. 
How is it used in technical analysis?
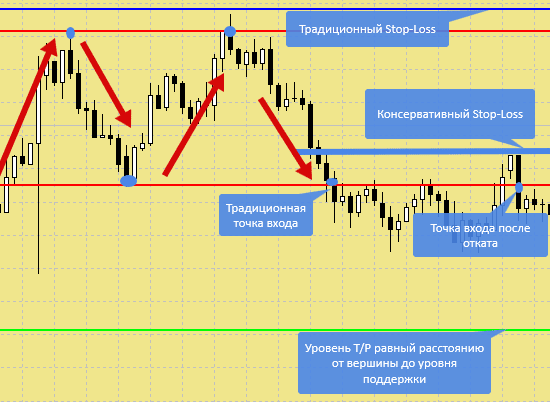
In the technical analysis of the market, double tops are used as signals for making a deal and entering the market. In the classic version of technical analysis, there are recommendations to enter the market and make deals when the price has broken through the support level and place a stop loss just above the second peak. https://articles.opexflow.com/trading-training/stop-loss.htm Market participants understand that when the price fluctuates, it reaches its peak values and certain decisions need to be made:
- those sitting in positions take profits, looking for an exit point from trading;
- observers – looking for an entry point against the trend, paying attention to strong positions.
Trading on the stock exchange on a double top – practical strategies and examples with descriptions and photo explanations
To minimize risks and profit from trading, you should follow two rules:
- Enter the market to sell only when the price breaks the neck line.
- Open a sell position after a second breakout of the support line by the price.
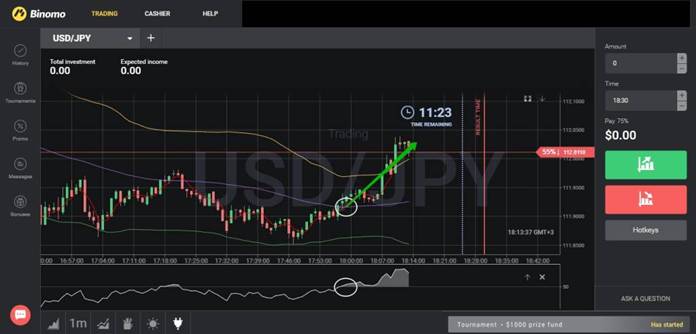
A double bottom is a mirror image of a double top, the trading rules for it are similar. A double bottom looms when a downtrend reverses.
Don’t Make This Mistake When Trading the Double Top Pattern
Based on technical analysis, traders are waiting for the breakdown of the support line to open a long trade. However, with this approach, you can fall into the trap of a false breakout, with a sharp reversal of the market. You can correct the situation by opening a position for a deal after a false breakout. A falling market will provoke the triggering of stop losses from traders standing in the long term, which will move the price even lower. https://articles.opexflow.com/analysis-methods-and-tools/proboj-urovnya.htm Trading this pattern is trading against the long. Price Action: double top/bottom pattern – a complete guide to chart identification, trading strategy: https://youtu.be/gRyc7Vj-4jA
How to trade the double top pattern and make a profit?
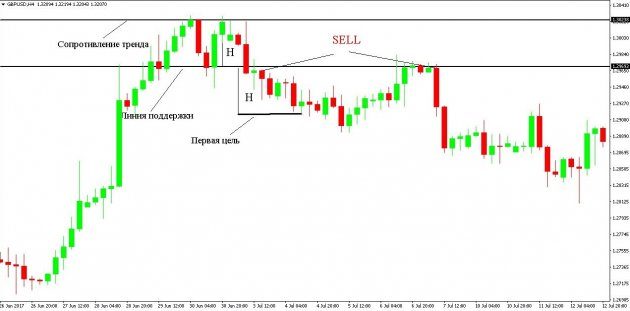
You can fix the profit from trading, relying on the double top, by calculating and fixing the take profit line. Take profit is calculated for the double top pattern, as well as for other technical analysis figures, according to the scheme:
- measure the distance from the support line to the peak (resistance level);
- we wait for the breakdown of support and postpone the received value from the support line.
At this level, we fix the profit. The following strategy will allow you to earn on the deal:
- open a short trade on the breakout of support;
- fix the stop loss behind the breakout line;
- when the price reaches take profit, we fix the profit.
Reliable Entry Technique
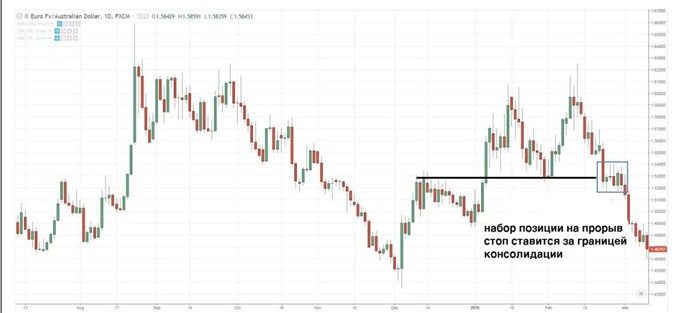
Before entering a long position, you must:
- find a potential double bottom;
- wait for the price to move up;
- notice a rollback in the form of tight consolidation;
- open a sale after the price goes beyond the range.
Pros and cons of the pattern
The advantages of the double top and double bottom pattern include efficiency at different time intervals (M15, H1, H4 or D1). This makes it possible to use them in the analysis of day,
swing and position traders. These are universal figures that work with different stock market instruments: stocks, currency pairs, raw materials, etc. https://articles.opexflow.com/trading-training/skolko-zarabatyvayut-trajdery.htm pattern has its drawbacks. The main one is that the double top does not guarantee the consolidation of the formed trend. For example, bears in a double day can reverse prices for the third time, break through the support level. Thus, care must be taken to minimize risks.
Mistakes and risks
The main mistake in trading with a double top pattern is opening long positions immediately after the price breaks out. The danger is that in this case there is an opportunity to start trading against a major trend. This happens when the market forms a small double bottom, most often it will continue to fall.
To avoid large losses, you need to add a moving average by setting the period to 20. If the price is below the moving average, you can not buy on the breakout line.
When trading a double top, you need to make sure that the price is not higher than the moving average by more than 20 points. The versatility and reliability of a double top and double bottom cannot guarantee a trend reversal. Losses can be avoided by applying two rules:
- Set stop loss between support/breakout and peak.
- You cannot use more than 1% of your balance per trade.
The application of these rules ensures that risks are minimized. A universal and reliable method in technical analysis gives greater accuracy in trading at large intervals. With a large interval, the patency of the signals increases, the trader does not need to wait several hours in front of the pattern formation monitor.
