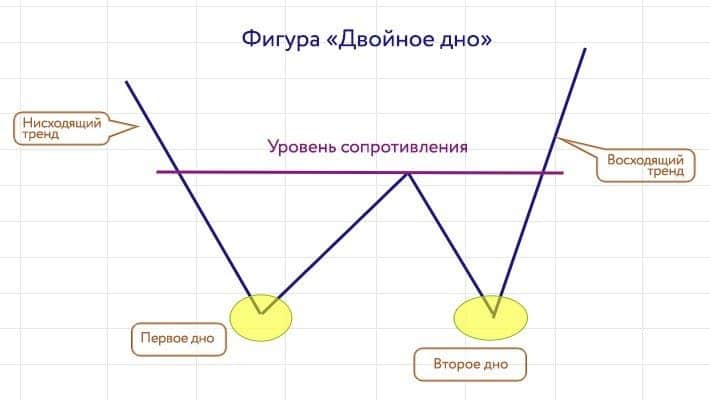
What is a double bottom in trading, how it looks on the chart and how to trade – strategies and tips. An important element in the technical analysis of stock market assets are graphical configurations with a special name – patterns. The classic scheme of such a pattern is the “double bottom” image, indicating a possible reversal of a downtrend.

- Short educational program – what are patterns?
- How to calculate a double bottom on a chart
- The constituent elements of the pattern
- Formation of a double bottom pattern in trading
- double bottom stats
- Trading on the exchange according to the double bottom pattern
- Don’t Make This Mistake When Trading the Double Bottom Pattern
- How to trade a double bottom and make a profit
- Reliable Entry Technique
- Pros and Cons of the Double Bottom Pattern
- Mistakes and Risks in Pattern Trading
Short educational program – what are patterns?
Trading patterns are graphic patterns found on price dynamics indicators. They are the basic elements of technical analysis, allowing you to predict the movement of the value of assets. They have been actively used by financiers since the time when it became possible to track charts on the monitor screen. Currently, more than a hundred patterns have already been identified that are used in the field
of technical analysis . Thanks to this trend, even a whole section of graphical analysis appeared in trading. https://articles.opexflow.com/analysis-methods-and-tools/svechnye-formacii-v-tradinge.htm
Note! Many patterns that are freely available are hypothetical patterns created by ordinary traders.
One of the classic trading patterns is the double bottom chart. It is often found in the market after a downtrend. Such a figure portends a change in the price movement for a financial instrument. The probability of this event is additionally increased if there is a large gap between the minima in the pattern.
How to calculate a double bottom on a chart
The constituent elements of the pattern
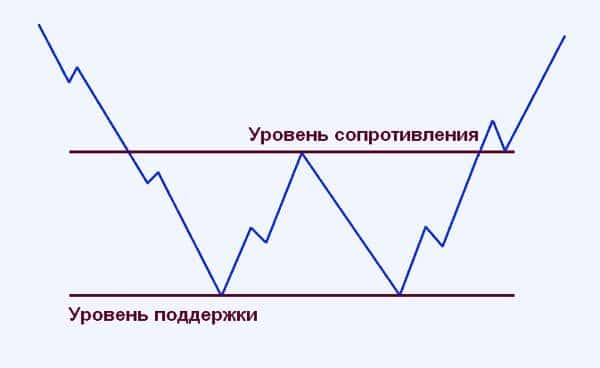
The figure is a combination of several components that form a double bottom pattern. These include the following elements:
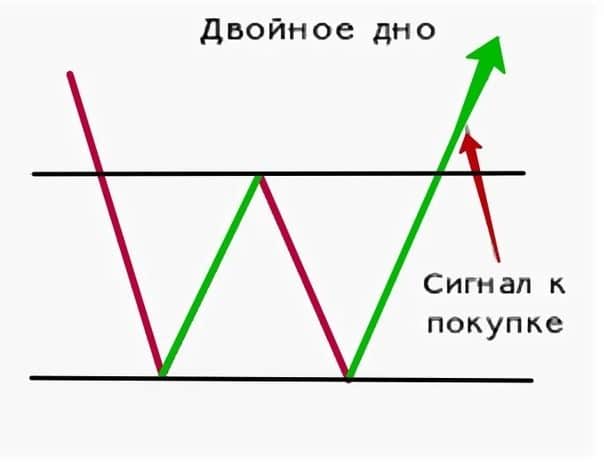
- Minima . The first and second low show when the price bounces back to a certain value.
- Climbing . Appears after the first bottom and is accompanied by a price increase of 10-20%. Usually the highs are deliberately rounded to form a resistance line.
- Climbing Breakthrough . After the appearance of the second bottom, the price should reach the line of the first ascent. This indicator indicates that the value of the asset is likely to begin to grow rapidly.
Formation of a double bottom pattern in trading
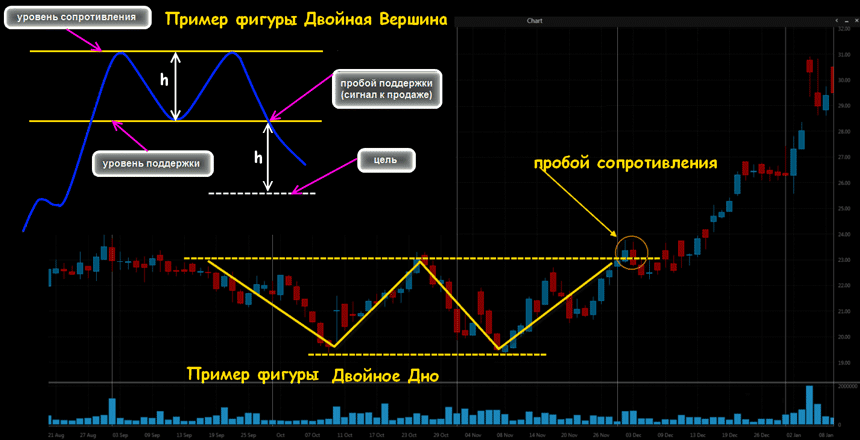
The formation of a pattern occurs when a downtrend is formed, further leading to the breaking of the first bottom on the chart. Then, an ascent must necessarily appear, exceeding the bottom by at least 10%. During the appearance of the first low and rise, it is difficult to identify that the pattern presented will be a double bottom. It is advisable to wait for the second low to be broken, which should occur no earlier than one month. What is a double bottom in trading: https://youtu.be/q-0E2gPEbk4
double bottom stats
– In 70% of cases, the movement is bullish after the appearance of a double bottom. – In 67% of cases, the price rises when the neckline breaks. – In 97% of cases, the upward movement continues when the neck line of the double bottom of the pattern breaks. – In 59% of cases, the price pulls back in the support of the double bottom neck line after the exit.
Trading on the exchange according to the double bottom pattern
One historical example of double bottom speculation is the rise in Vodafone Group shares in November 2018. They rose more than 9% after the company reported better financial results. More importantly, the incoming CEO indicated that Vodafone’s dividend is safe, despite the efforts of Liberty Global’s German businesses to counter it.


Don’t Make This Mistake When Trading the Double Bottom Pattern
The main mistake that beginners often make when working with a double bottom is to immediately open a long position after breaking the second bottom when the price breaks to the cutout line. Such carelessness leads to financial losses, as the overall market may be in a bearish move. The small double bottom will not go up and the overall downtrend will continue. This effect often occurs when an asset is bought at a price below the MA. At the same time, an important step that will help the trader avoid risks is placing a stop loss. To feel stable, it must be placed between a breakout and support.
How to trade a double bottom and make a profit
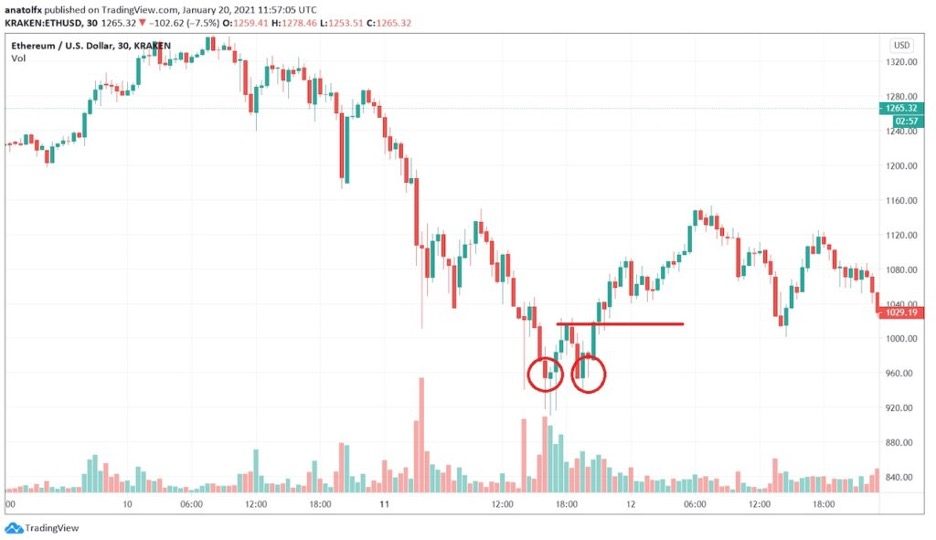
This term was taken from shipbuilding. In trading, it is a graphical model of stock behavior. It looks like this – the asset level on the chart drops to a low level and breaks through the bottom, after that it rises not much and for a short time. Then it repeats all over again. After the appearance of this figure on the chart, experts expect a strong increase in the asset. It is believed that, having discovered a real double bottom, you can very successfully make a profit through trading. However, there are cases of false double bottoms:
- The depressions appear too early, faster than a month.
- Rise between falls should be at least 10%
It should always be remembered that the algorithms for the behavior of graphs are very complex and have not been studied. It is not worth relying entirely on certain strategies. However, pattern tracking can lead to high profits.
Reliable Entry Technique
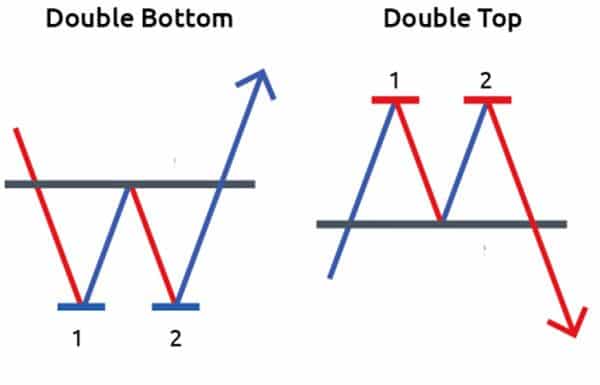
Very often, the price rollback occurs after reaching the ascending line. However, a trader can see in advance what the situation will be with the asset if you follow several factors:
- Identify a potential double bottom in the stock market.
- Wait for the price to rise after reaching the second low.
- Determine the presence of consolidation.
- Open a trade after the ascent breakout.
This is the best and most reliable entry scheme that gives the user the opportunity to complete a transaction with minimal risk. In this case, you should also place a stop loss at the low of the range boundaries.
Additional Information! A weak pullback, turning into a tight consolidation, indicates a lack of pressure from sellers. However, if the price continues to rise, making a rapid jump from the point of ascent, you should not continue to chase the market. The best strategy would be to analyze the situation and open a position with a stop loss at a distance below 1ATR from the entry point.
Pros and Cons of the Double Bottom Pattern
The main advantage of the pattern is its wide use at different time intervals. The configuration is equally effective as on the M15, H4 or H1. The technical analysis of the double bottom pattern can help both day traders and
swing specialists. At the same time, the universality of the pattern lies in the fact that it can be used when working with different assets:
- currency pairs.
- Stock.
- Valuable metals.
- Commodities.
However, like other patterns, a double bottom cannot guarantee a long-awaited profit and a repetition of the formed trend. That is why each user should use special risk management tools.
Mistakes and Risks in Pattern Trading
The sphere of stock and financial markets is certainly accompanied by risks and losses that every trader can face. The most common mistake when working with a double bottom can be the wrong pattern definition. In some cases, it can be mistaken for a false configuration. This can be seen in the following example.

