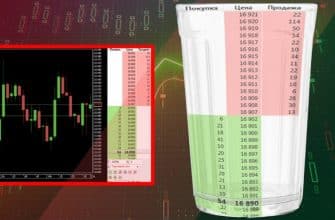
Bollinger Bands (sometimes Bollinger Bands) – what are they and how are the Bollinger Bands indicator used? In order to more accurately assess the likelihood of one or another variant of price changes in the future, the
methods of fundamental and technical analysis are used . In the first case, the situation is analyzed taking into account the impact of economic factors. At the same time, it is not always possible to predict exactly how they will affect the value of specific shares. It often happens that important events affect prices too quickly and the trader does not have time to take advantage of this. Bollinger Bands Indicator:
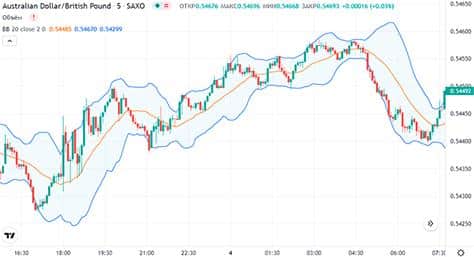
- The center line is the average price. It shows the trend of movement and allows you to make an assumption about the general nature of the changes.
- The top and bottom lines represent the degree of deviation from the center line. The difference between them is the greater, the sharper the changes in quotations occur.
Philosophy and history of the indicator
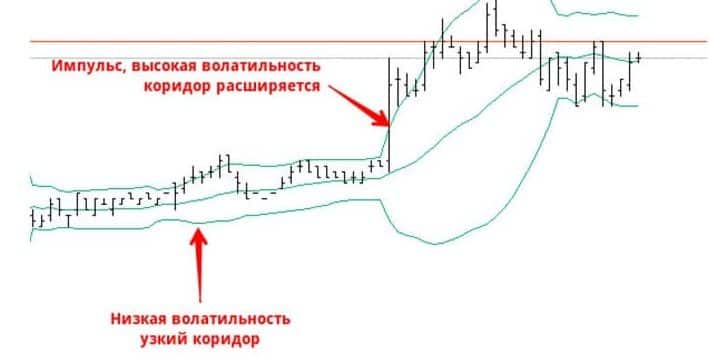
This indicator was created by John Bollinger in the 1980s, a Wall Street trader and analyst. Already within the first decade after its creation, the indicator gained wide popularity, which remains after decades. It allows you to understand how prices are distributed in relation to the average value of an asset. In the presence of high volatility, the distance between the lower and upper lines increases. John Bollinger wrote the book “Bollinger on the Bollinger Band”, which details the rules for applying.
How bollinger bands are used
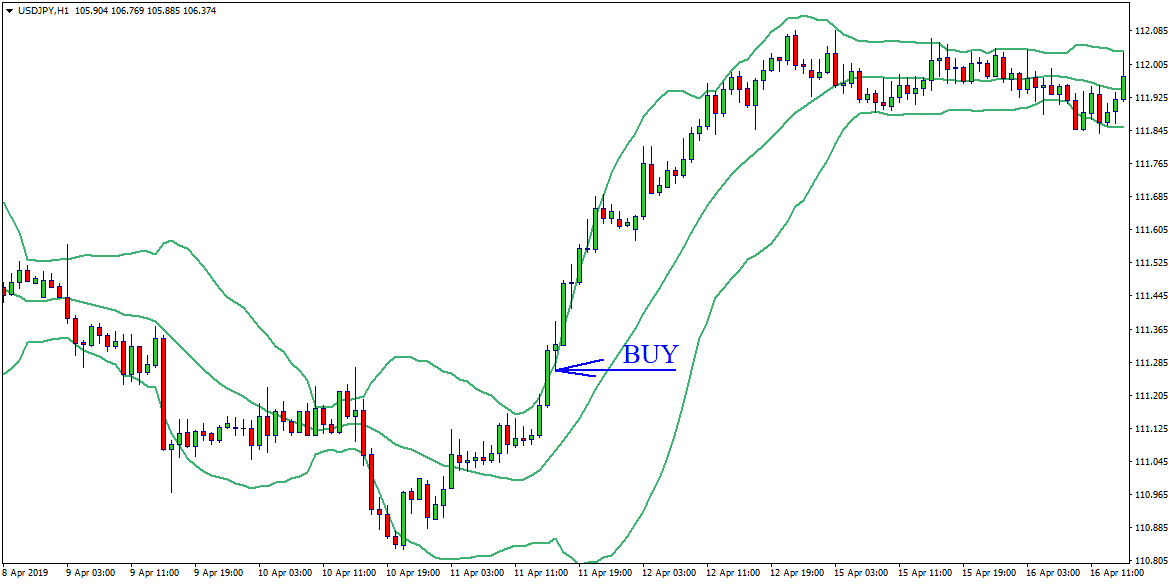
The use of the indicator under consideration is usually associated with the determination of a promising direction for a transaction. For successful work on the exchange, a trader must determine which trading system he will use. To do this, you need to understand exactly what action needs to be taken in each possible situation. Usually, when creating such a system, several standard elements are used. One of them is as follows. First you need to determine if the market is trending. It may tend to rise, fall, or fluctuate in a horizontal channel. In the first and second cases, it can be argued that it is trending. If the quotes rise, then it is profitable to buy the asset, and if they fall, then sell. Trend indicators provide an answer to the question of which of these situations occurs.Bollinger bands can perform this function in the trading system. Useful QUIK functions – indicators RSI, MACD, Bollinger Bands: https://youtu.be/jMjVqSxQdxU The indicator can also be used to determine the targets of selling or buying. Its lines show where you can withdraw profits. Similarly, using Bollinger Bands, you can determine the stop level in your trades. A narrowing or widening of a band indicates the level of volatility and market trend. A narrow, inclined strip indicates more strength of movement. If it expands, then some traders see this as a sign of an imminent termination of the trend. If the indicator narrows strongly during a sideways trend, then this indicates a high probability of an explosive movement.be / jMjVqSxQdxU The indicator can also be used to determine the targets for selling or buying. Its lines show where you can withdraw profits. Similarly, using Bollinger Bands, you can determine the stop level in your trades. A narrowing or widening of a band indicates the level of volatility and market trend. A narrow, inclined strip indicates more strength of movement. If it expands, then some traders see this as a sign of an imminent termination of the trend. If the indicator narrows strongly during a sideways trend, then this indicates a high probability of an explosive movement.be / jMjVqSxQdxU The indicator can also be used to determine the targets for selling or buying. Its lines show where you can withdraw profits. Similarly, using Bollinger Bands, you can determine the stop level in your trades. A narrowing or widening of a band indicates the level of volatility and market trend. A narrow, inclined strip indicates more strength of movement. If it expands, then some traders see this as a sign of an imminent termination of the trend. If the indicator narrows strongly during a sideways trend, then this indicates a high probability of an explosive movement.A narrowing or widening of a band indicates the level of volatility and market trend. A narrow, inclined strip indicates more strength of movement. If it expands, then some traders see this as a sign of an imminent termination of the trend. If the indicator narrows strongly during a sideways trend, then this indicates a high probability of an explosive movement.A narrowing or widening of a band indicates the level of volatility and market trend. A narrow, inclined strip indicates more strength of movement. If it expands, then some traders see this as a sign of an imminent termination of the trend. If the indicator narrows strongly during a sideways trend, then this indicates a high probability of an explosive movement.
Pros and cons
The application of the indicator in question creates a detailed picture of the price movement. Understanding the principles of its work allows you to draw the necessary conclusions when deciding on a deal. An example of using the Bollinger Line indicator:
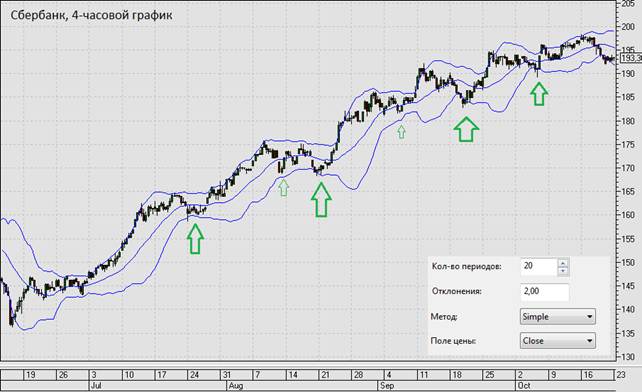
- You can determine if the market is trending and indicate its direction.
- There is information about the level of price volatility.
- The definition of overbought or oversold of an asset is available.
- Together with other indicators, it can be used to find the moment to enter or exit a trade.
When using it, one must take into account the presence of such disadvantages:
- Although Bollinger Bands are a very informative indicator, they do not provide any guarantees of absolute prediction accuracy . It is impossible to exclude the influence of random circumstances that can negatively affect the profitability of the trade.
- Since the average value is used taking into account the last 20 bars, this indicator has a lag . This is a common property of those indicators that are based on the use of calculating the average.
- It should be borne in mind that when the price approaches the boundary line, it is possible not only to reflect it, but also to expand the band . Likewise, other signals can create ambiguity in the future.
Bollinger Bands provide more reliable signals when used in conjunction with other indicators. As additional ones, it is more profitable to use those in the construction of which other calculation principles are used.
Building
The plotting rules are as follows:
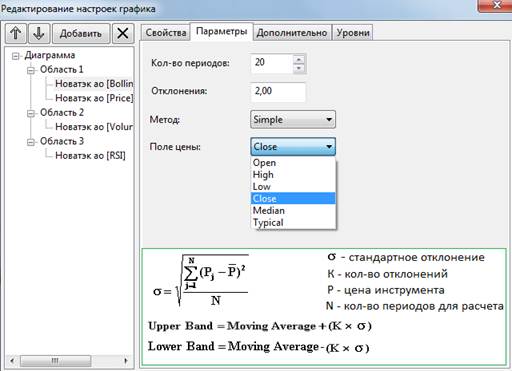
- First, you need to calculate the moving average. Usually, to get it, the arithmetic mean of the Close values of the last 20 bars is used. The developer used a simple average to calculate, he said, in order to apply the same method to plot the centerline and get the deviations.
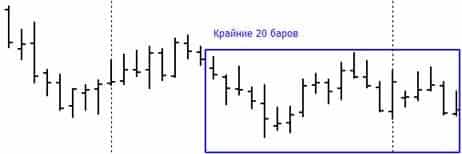
- The standard deviation is calculated. Two such values are plotted up and down from the mean line. The deviation is the greater, the stronger the volatility. When it decreases, the distance between the upper and lower lines decreases.


Bollinger Band Strategy – Practical Application in Analysis
The use of the indicator is based on its high information content. In combination with other indicators, Bollinger Bands allow you to determine not only the direction of the transaction, but also the moment to enter it. Below are a few examples to illustrate the application.
Rebound from borders
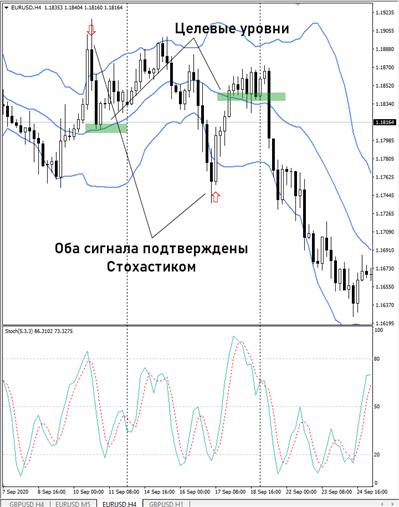
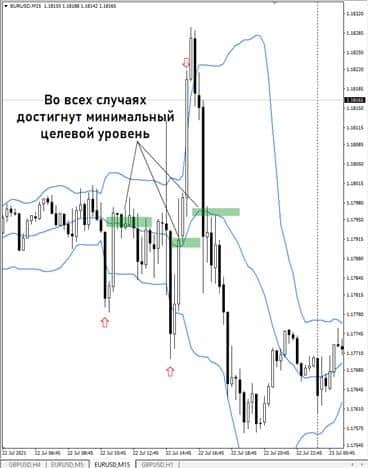
Reaching target level
Sloping support or resistance lines
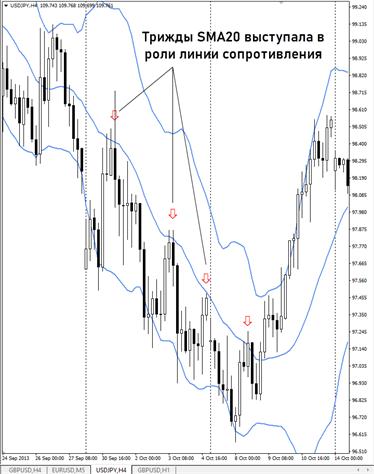
In the chart shown here, the red arrows show 4 bounces from the centerline during a down trending move. These cases are good times to enter a sell trade. You can see that on this chart, the first three trades would be successful if closed after crossing the lower line. The latter, due to the change in the direction of the trend to an upward one, will not lead to a quick intersection with the lower line. In order to limit losses in the latter case, it is enough to place a stop on the center line of the Bollinger indicator.
Horizontal support or resistance lines
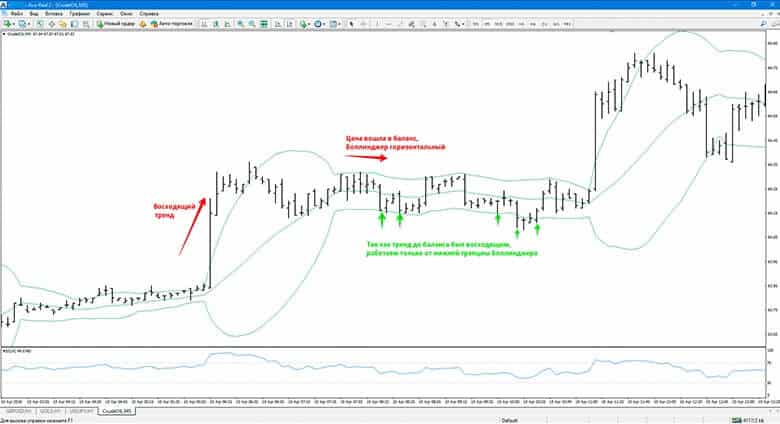
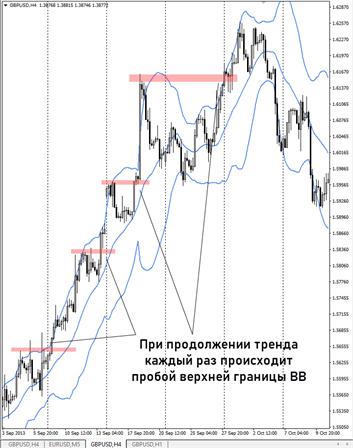
If the indicator is used in a trending market, it can repeatedly touch the outer line and go back. Each such bounce can be considered in a growing market as a resistance line. When, during further movement, the quotes pass it, this indicates the strength of the movement and allows you to use this moment to enter a deal or build it up. A stop can be placed immediately after each resistance line, providing an almost breakeven further development of the transaction. Considering the chart shown as an example, it can be seen that such a stop will be triggered only after the last of these lines is crossed. In order to more accurately determine all the necessary parameters of the transaction in this and other examples, it is advantageous to use additional signals received by the indicators. Determine which of them the trader should need, determiningwhat trading system he plans to work with.
Terminal use
Bollinger Bands have long been considered a classic technical analysis tool. Therefore, in most cases, they are included in the number of pre-installed technical analysis tools. The procedure for calculating the indicator:
