RVI indicator, Relative Vigor Index (Relative Vigor Index) – how to use, how to set up and use.
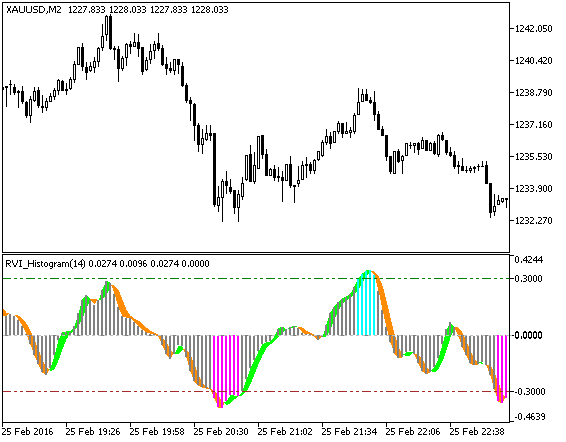
RVI indicator, Relative Vigor Index (Relative Vigor Index)
John Ehlers created the trend indicator at the beginning of the 21st century, it is used to determine the strength of sellers and buyers. Elerds is a well-known technical analyst, creator of many strategies and technical indicators and oscillators. In 2022, RVI is in any set of indicators of popular
trading platforms .
What is the RVI indicator
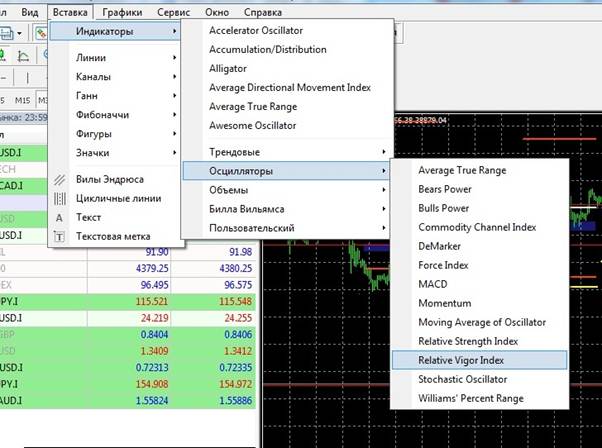
After selecting an indicator, the user will be prompted to select its period for calculating the average value, the color and thickness of the lines. The longer the averaging period, the less it reacts to price fluctuations. There will be fewer signals, but they will be of better quality. RVI indicator – by default, the oscillator contains a red fast and a green slow line. The fast (red) line shows the short-term balance of power in the market. A slow line signals the alignment of forces over longer periods of time. The red line is the sum of moving averages for 4 periods – at closing, opening, high and low prices. The second line is plotted as a symmetrically weighted 4-period moving average.
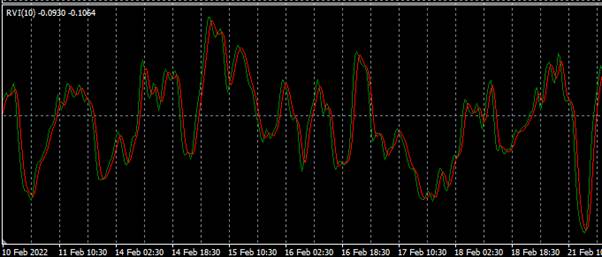
The overbought and oversold areas are displayed in the indicator with errors, so it is recommended to reinforce the signals with another oscillator, for example, a stochastic.
How to trade with RVI
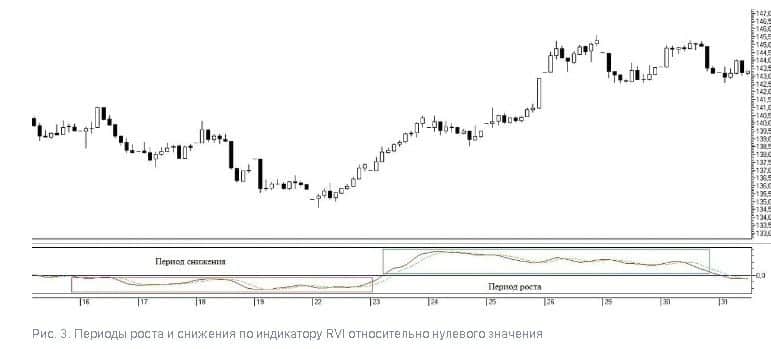
The RVI indicator is used to determine the strength of the current movement, the confidence and energy of the trend. It can be used to determine the probability of a trend continuation. The indicator shows how smoothly prices move across different timeframes. The principle is that in an uptrend, the highs rise, and in a downtrend, they fall. The movement will continue if the price closes near the extreme. If the price makes volatile fluctuations, while moving far from the extremes to the middle of the range, then the trend is likely to change direction or die out.
Trading signals of the RVI indicator
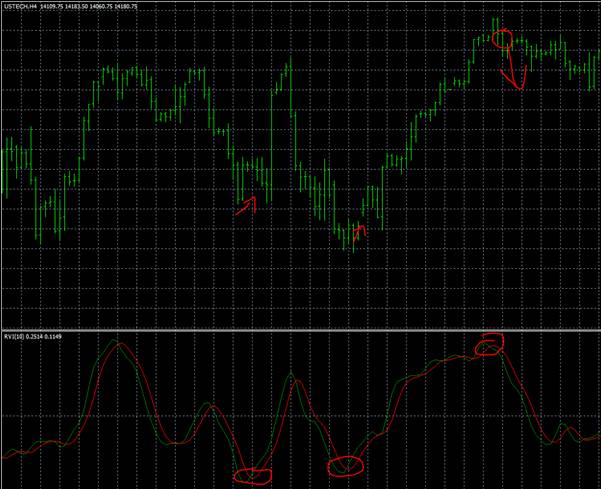
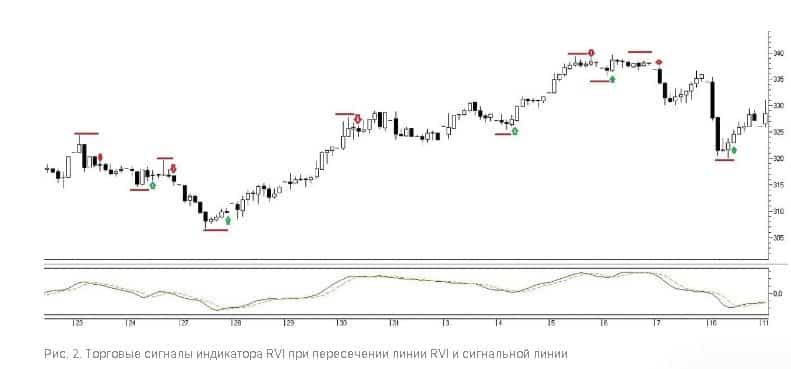
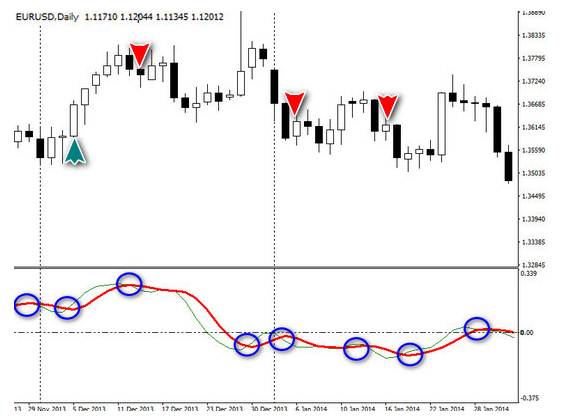
The trader receives signals on the intersection of RVI lines.
- If the fast line crosses the slow line from top to bottom , then a purchase is made on the next candle. A trader can buy on the market or place a pending order to make a deal at a price above the local maximum.
- If the fast line crosses the slow one from the bottom up , then a sale is made on the next candle. A trader enters the market on the next candle, or places a stop-limit order beyond the local minimum.
Positions can be held until the opposite signal of the indicator, or exit on a trailing stop, sufficient profit. Many traders stick to a 1:3 or 1:5 ratio between stop and take.
Signal filtering
The Relative Vigor Index is a trend-determining tool, so when the price is in the range, its use causes losses. To filter out erroneous signals,
Japanese candlestick patterns are used , a set of indicators – usually from 2 to 5.
moving average. The indicator shows entry points and MA shows the trend. A signal to buy on the indicator is only looked for if prices are above the MA, and to sell when the price is below the MA. Stop loss is set slightly above or below the moving average. When filtering with Japanese candlesticks or chart patterns, after receiving the indicator signal, the trader should find a chart pattern in the same direction. The entry is carried out according to the figure, and the exit is carried out with the opposite signal of the indicator and the figure in the opposite direction. When filtering using other indicators, you need to get an entry signal from at least 2 out of 3 indicators.
pyramiding
A trader can increase his profit without exceeding the risk by using the pyramiding trading strategy. At the same time, while the trend is alive, the trader increases the volume in the transaction and moves the stop loss so that the total risk in the transaction does not change.
- the average price of the total position is calculated and the stop is placed behind the nearest level, so that the losses do not exceed 1-2%;
- stop is set only for the last 1-2 trades, approximately 30% of the volume. For most of the position, the stop is held at the original level or moved to breakeven.
Pyramiding can multiply profits with strong trends, but is ineffective with prolonged sideways.
Setting up the RVI indicator in the terminal
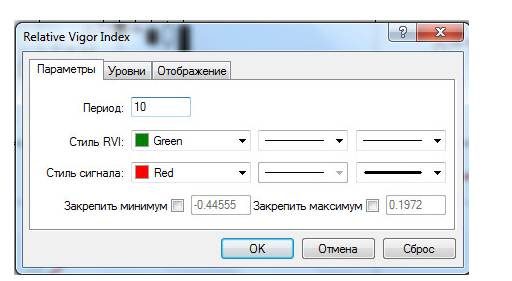
The creator of the indicator did not give many parameters to change, you can only change the averaging period, adjust the color scheme, line thickness and fix the minimum and maximum. The default period is 10, it is recommended to use it on daily charts. When using the indicator on smaller timeframes, you should optimize this parameter, set the value to 288 on a five-minute chart or 64 on an hourly chart. It is worth choosing a parameter equal to the number of candles per day or week, or pick it up by brute force. It is necessary to ensure that the highs of the indicator coincide with the highs of the price in most cases. You may find the default averaging setting to be satisfactory. For each tool, you need to select your own parameters.
Advantages and disadvantages of using the RVI indicator
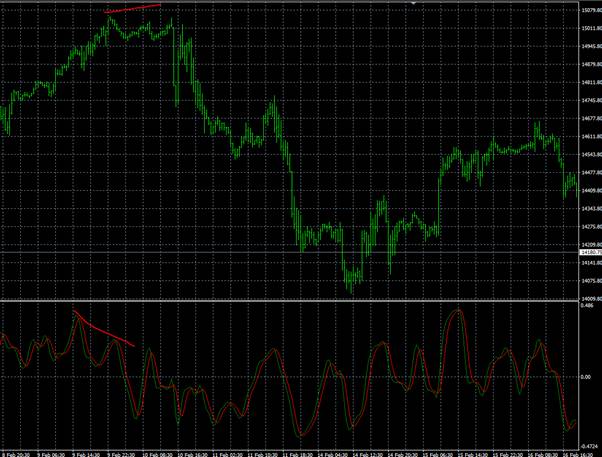
Among the advantages of the indicator, it should be noted an accurate graphical description of market cycles, due to which this indicator is often used in the verification of Elliot waves. Experts believe that the use of the RVI indicator as a filter for other systems is more efficient. At the same time, low working out of divergences is noted, especially with long-term trends. Good results are shown by pyramiding on the signals of this indicator in trend instruments. At the same time, it gives a lot of false signals in sideways, which are poorly filtered by other oscillators.
The advantages of the indicator also include versatility, the ability to use in different trading systems, ease of use and configuration.
First of all, RVI is recommended for experienced traders who know how not to trust any information they receive. Novice traders should be extremely careful with it. When using it, you should set a fixed stop loss, do not think that they will put a stop when the indicator shows a change in direction.
For an inexperienced trader, the incorrect use of the indicator can lead to a complete drain of the trading deposit.
Indicator Relative Vigor Index (RVI) – calculation formula. 2. The essence of the testimony. 3. Options. 4. Trading signals. 5. How to use it in trading: https://youtu.be/ps3NS9pvhSo The RVI indicator is a unique tool for determining the strength of a trend, displays the probability of a continuation of the movement. Combined with other tools – Elliot Wave Theory, Price Action, Japanese candlestick patterns, technical analysis figures – this is a strong technical analysis indicator for trend trading systems. The indicator can be used on small timeframes to trade sideways on hourly charts from support to resistance, but this is ineffective. It was built to work on daily charts and works best on them. It is said that over 70% of the time the markets are flat, but this should not be taken literally. For a long time, the market accumulates energy for movement. but when it comes its strength is not comparable to anything. The main money is made on powerful trends, not in long saws. Especially if the trader uses the pyramiding strategy. And the RVI indicator will provide invaluable assistance in determining the right direction.
