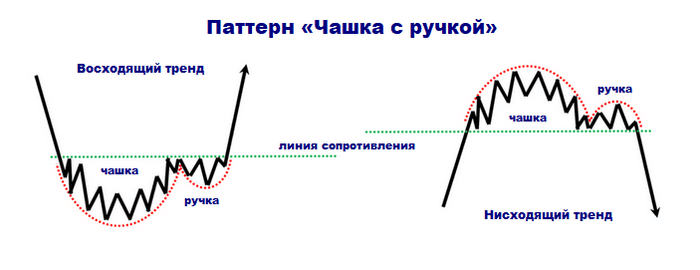
Patterns “Cup with handle” and “Saucer” on the price charts are formed over a long period and are quite rare. However, they serve as good signals: the first may indicate a continuation of the long-term bullish trend, the second – the upcoming reversal of the bearish trend.
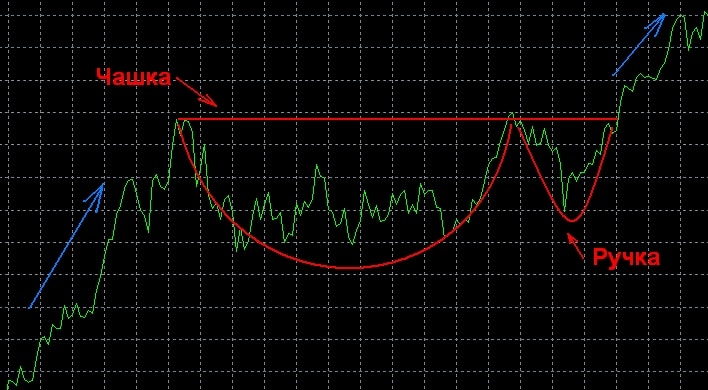
Description of technical analysis charts Cup with handle and Saucer
“Cup with handle” and “Saucer” belong to different groups of patterns: trend and reversal, respectively. As a rule, they are used by experienced investors who are focused on long-term investments.
On short timeframes, such figures are rare and are considered weak signals.
Pattern “Cup with handle”
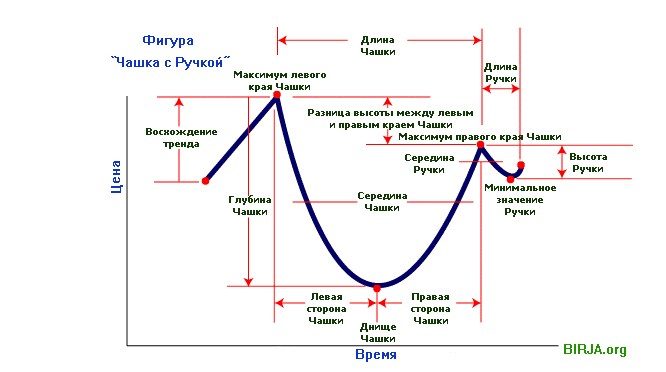
The Cup and Handle price pattern is a U-shaped figure with a small branch (correction) at the right end. This technical analysis figure is considered a bullish signal and is regarded as a sign of the continuation of the uptrend. 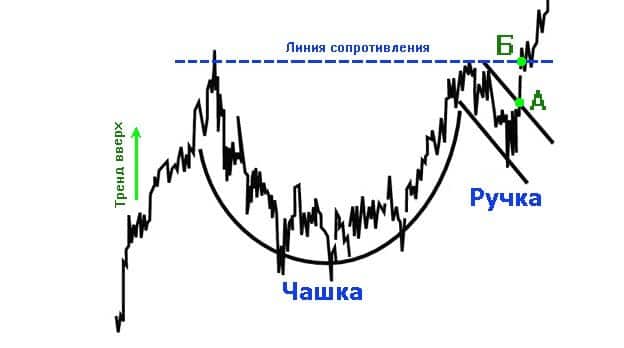
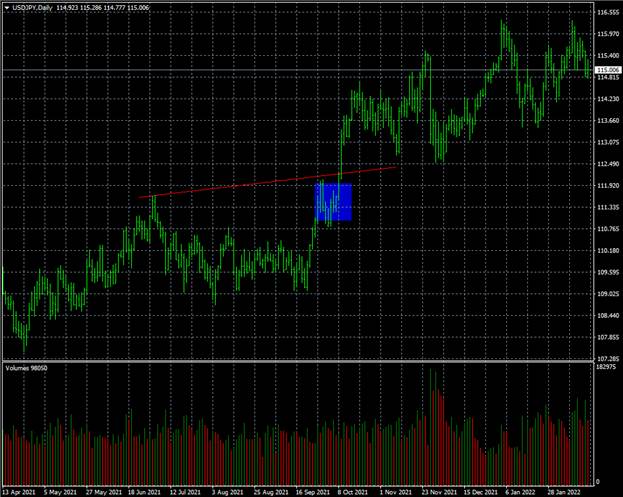
- The U-shaped bottom of the figure has no sharp corners;
- the concave parts are not too deep;
- volume is directly proportional to price.
Pattern “Cup with handle” in real trading, description and what the model means in technical analysis: https://youtu.be/WB-xPUxdL98
Saucer Pattern
The Saucer pattern signals a possible reversal of the prevailing trend. It is a U-shaped formation that appears at the end of long downtrends and often indicates an imminent price reversal. The time frame of the pattern can vary from a week to several months. At the same time, it is difficult to clearly indicate when the figure was formed. Formally, it is believed that this happens at the moment of overcoming the level at which it began to emerge.
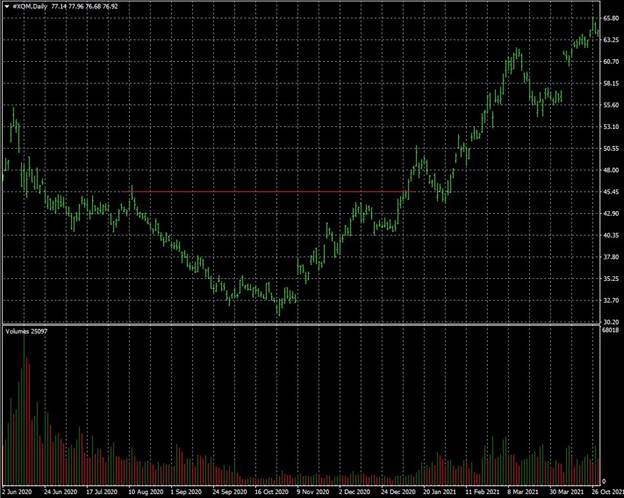
- the appearance of the figure is preceded by a pronounced long downtrend;
- upon reaching the price minimum, the consolidation phase begins, the graphical expression of which is the flat bottom of the “Saucer”;
- price and volume move in tandem.
Varieties of technical analysis figures cup with handle
The described patterns of technical analysis can be viewed inverted, reflecting processes that are opposite to those that are observed in the case of the formation of standard patterns.
Inverted cup with handle pattern
An inverted cup and handle is a bearish trend continuation pattern. The formation of the pattern begins with the rise in the value of the asset. Further consolidation is observed, and the price returns to the position at which the growth started. Then there is a small upward correction, after which the chart again rushes down.
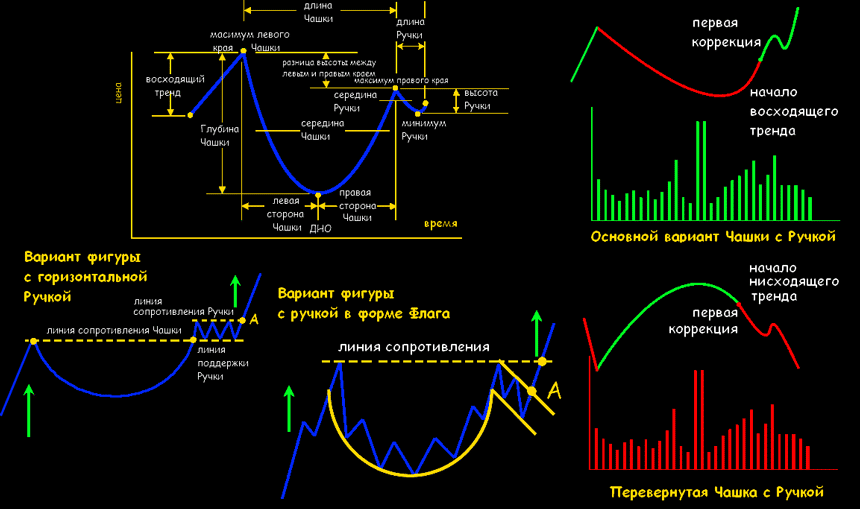
Model “Inverted saucer”
It indicates that the price of the asset has reached a maximum and the uptrend has come to an end. Since the price cannot rise indefinitely, at a certain point it tends to move sideways, then it starts to slowly decrease. After some time, the fall accelerates and a stable “bearish” trend is formed. This pattern does not allow for predictions regarding price performance, but indicates that assets are in danger of an unexpected and rapid fall.
Use in trade
Although the patterns under consideration are considered good signals on large timeframes, their identification requires the study of many indicators at the same time. Otherwise, there is a high probability of making a mistake. It is recommended to use additional tools, including indicators and fundamental analysis.
Trading with the Cup and Handle Model
There are 3 trading methods for the Cup and Handle pattern:
- Aggressive . This is the most risky method based on pen analysis. First, support and resistance levels are drawn for the chart in the correction range. As soon as the quotes “break through” the upper level, you can place orders. Stop Loss is marked below the breakout line.
- Standard . When the correction is replaced by a sharp surge in quotes and ends with a “breakout” of the level of its beginning, orders are placed. Stop Loss is marked below the resistance line.
- Conservative . This is the most popular approach since less risky and more reliable. When choosing the moment to enter the market, a breakdown of the technical line connecting the tops of the “cup” is expected. It is best to open orders after retesting the breakout line. Stop Loss is set below the “handle” or the candle formed during the “rebound” (if it is large).
[caption id="attachment_13475" align="aligncenter" width="652"]
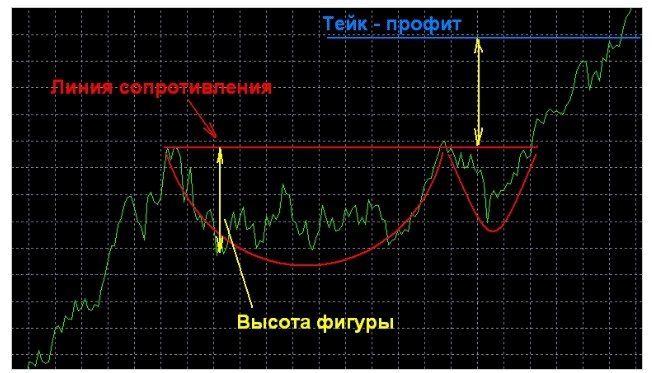
- the figure is preceded by a pronounced uptrend;
- the figure is clearly drawn when choosing large time intervals (D1, W1);
- The “cup” has the correct shape, which can be verified by calculations: the arithmetic mean between the top of the left wall and the minimum point of the bottom is less than the arithmetic mean between the extrema of the “handle”;
- the moving average line with a period of 200 is below the correction range.
Trading with the Saucer Pattern
Investors waiting for the possibility of opening long positions should watch the dynamics of the saucer bottom. At the time of the first surge in quotes, they continue to observe. A buy is made when a new spike in prices breaks the high of the previous one. Today, the “Saucer” figure is almost never used, because. there is high volatility in world markets. Predicting long-term growth is difficult.
