What are Pivot points (point of rotation) or Pivot Points in simple words, how to calculate, how to build, the essence of the Pivot Points indicator, how to use the indicator. Pivot Points, or classic Pivot Points, is a tool used by professional traders in all financial markets. It shows pivot points and allows you to build
support and resistance lines . This method provides high quality signals. It is also simple and easy to use even for novice traders.

What are Pivot Points
Pivot points, to put it simply, are trend reversal areas on a price chart. This is the numeric average of the high, low, and closing price of a particular asset on the previous trading day. Traders determine future price movements and base their trading plan in part on these pivot points.
This method was developed by Henry Chase in the 1930s. He calculated the pivot point using a formula that included the high, low, and closing value of the previous day. At that time, calculations were made manually, and traders traded without the help of computers.
The formula calculates the price target, according to which the levels are drawn. It was assumed that the price would break through them, or change direction. Now you no longer need to do the calculations yourself. There are many algorithms and services that do this. An important feature of this method is that it is not subjective. Everyone marks standard support and resistance according to their own rules. Although there are general evaluation criteria, their meanings vary from person to person. Pivots can be calculated using a formula and they are the same for everyone. For this reason, they are used by major market participants such as banks, market makers, etc.
How are pivot points calculated?
Traders were constantly trying to improve on the old methods. As a result, today there are several formulas:
- Traditional . The first method is the simplest.
- Classic . Slightly different, but has a similar application.
- Woody . The closing price is the most important in this technique.
- Camarilla . Used to determine stop loss and take profit.
- Fibonacci . The calculation uses the Fibonacci correction factor.
- DeMark . Prediction of extreme zones.
The traditional calculation method is very simple: add the low, high and close values. Divide the resulting value by 3: (high + low + close): 3 = Pivot. This value is the main one. The remaining lines are calculated on this basis:
- 3 bars above the midpoint – resistance.
- 3 lines below the center – support.
Each type is calculated differently. If necessary, you can calculate these values yourself, but it is not recommended to do this manually. It is better to use special techniques. Any of these types can be practiced. Usually, many start with the traditional option and are completely satisfied with it. They are also experimentally tested to determine the best option for a particular currency pair. Tom DeMark developed a parallel calculation system as shown in the table below.
| State | Formula | Today’s scores |
| If yesterday’s open > yesterday’s close | P = (Yesterday’s High x 2) + Yesterday’s Low + Yesterday’s Close | Low = P/2 – Yesterday’s High High = P/2 – Yesterday’s Low |
| If yesterday’s open < yesterday’s close | P = (Yesterday’s Low x 2) + Yesterday’s High + Yesterday’s Close | Low = P/2 – Yesterday’s High High = P/2 – Yesterday’s Low |
| If yesterday’s open = yesterday’s close | P = (Yesterday’s End x 2) + Yesterday’s Low + Yesterday’s High | Low = P/2 – Yesterday’s High High = P/2 – Yesterday’s Low |
Some analysts also apply today’s open price to the equation for calculating the primary average. 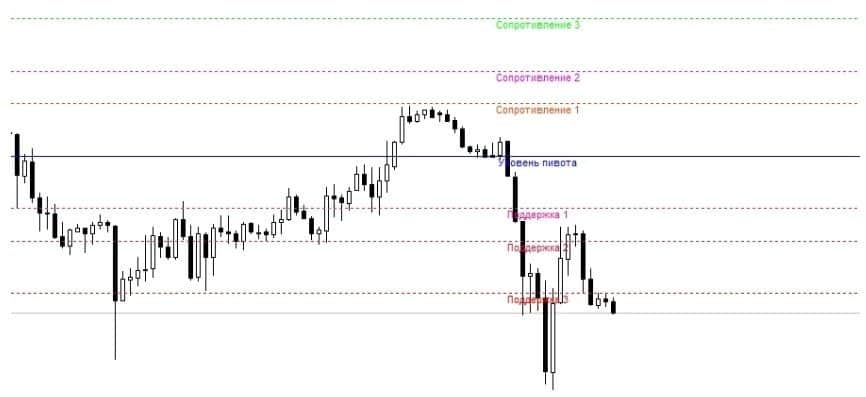
What is Pivot Level?
The Pivot Point indicator is based on the idea that the market counts everything and that history repeats itself. This is the principle of the indicator: the closing and opening prices of the candle can be used as support and resistance levels in the future. Therefore, traders use a large time frame to set levels and then apply them in their trades. Let’s say levels are calculated on charts D1 and above, and trades are placed on charts of a smaller time interval, for example, M30 and below.
It’s also important to note that Pivot levels do not represent a specific number or price on a chart: they represent a range that prices can stay within a certain period of time.
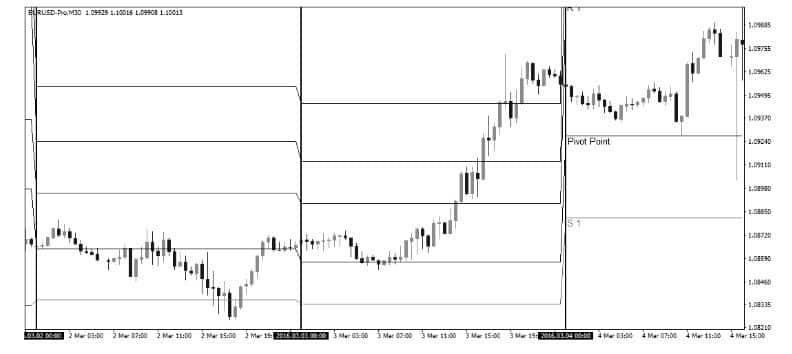
How Pivot looks on the chart
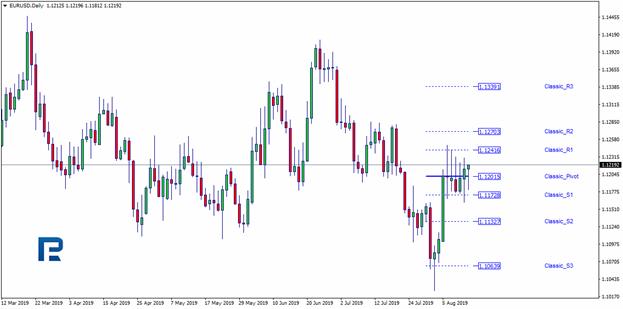
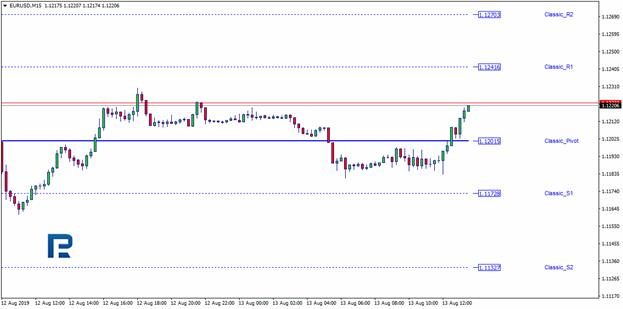
Pivot levels are displayed on the chart as horizontal lines, while the middle level is highlighted, and support and resistance levels are dashed by default (the color and style of the level lines can be changed in the settings as desired).
Trading strategies
There are the following main strategies for trading pivot points:
- Open short positions when the price is below the main pivot point.
- Open long positions when the price is above the main pivot point.
- Be in a long position when the price moves away from S1, S2 or S3.
- To be short if the price moves away from R1, R2 or R3.
The following are the main trading strategies used with Pivot Points:
- If the price action fluctuates and bounces before reaching the pivot level, enter the trade in the direction of the bounce. If a trade with a price above the pivot line is being tested and the price is approaching the pivot line and returning to the uptrends, a long trade should be entered. On the other hand, if the downside pivot line is being tested and the price returns to the downside after hitting the pivot point, sell short. The stop loss for a trade is above the pivot line if the trade is short and below the pivot line if the trade is long.
- When the price action breaks through the pivot line, then the trade should continue in the direction of the breakout. For a bullish breakout, the trade must be long.
https://articles.opexflow.com/analysis-methods-and-tools/podderzhki-i-soprotivleniya-v-tradinge.htm
An example of trading by points and levels Pivot
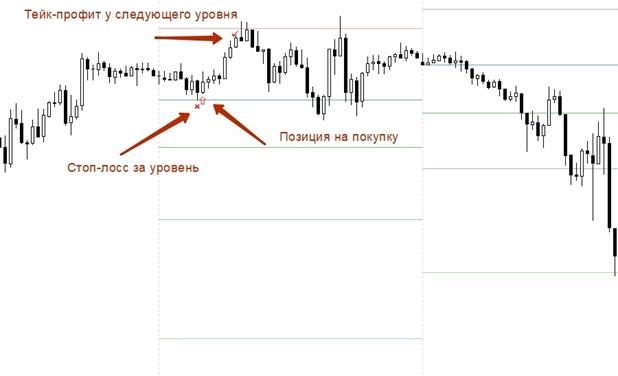
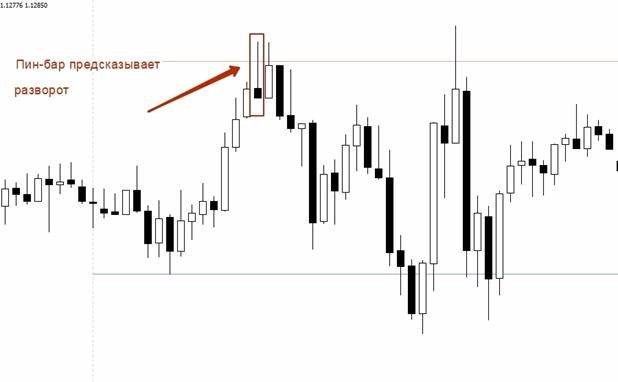
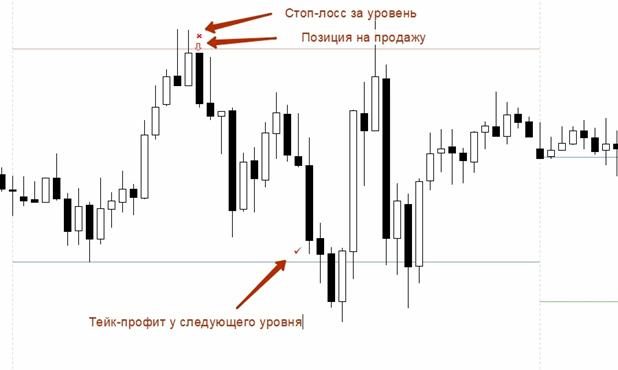
Traders often do not choose in advance what to trade today. They watch the market and choose tactics based on what is happening. Let’s look at an example of how you can implement Pivot Points in your daily activities. Let’s open a currency pair and apply Pivot points to it. This example uses the Pivot Points All-In-One algorithm, which is generic and can use various formulas. The classical method based on the standard method is shown. Currency pair – EURUSD, time interval – M30. First you need to determine the current trend. There is a general rule that shows investors direction. When the day opens above the main level, buy positions will be considered. If it is lower, they will look for sell entries. The main line is marked in blue, and if the opening day is above it,
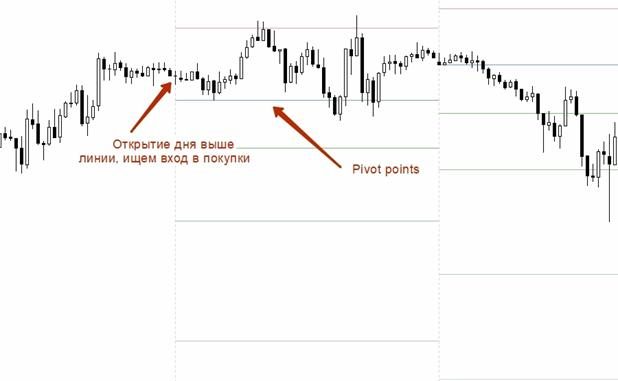
- Stop-loss is placed behind the line.
- Take-profit – at the nearest line.
Pros and cons of the Pivot Points indicator
The advantages include the following:
- Ease of use.
- Gives an idea of possible price movements.
- Mathematical calculation based on specific values.
- It can be applied to various time intervals.
- You can trade with pending orders.
The Pivot Levels Indicator is undoubtedly a very powerful market analysis tool and, if used correctly, can be very useful for both beginners and experienced traders in trading the financial markets. Unlike other trading tools that use long timeframes, the Beer Points indicator receives data from one day of trading. Predicting the likely level of support and resistance requires high, low and close prices from the previous day. The disadvantages of the indicator include many calculation options, which leads to confusion as to which one is better, more correct or more accurate. If you use the calculation of the D1 index, the current data may be out of date for the next trading session. The Pivot Point Indicator is an easy to use tool that has been included in trading platforms.


Просто и доходчиво изложен материал.