A star in trading is the meaning of a pattern, a variety, what it means and how to read it on a chart. Novice traders who are just learning the specifics of trading on the stock exchanges are often confused about the meaning of complex terms and in mastering the tactics of trading on technical analysis. Not every beginner knows, for example, what a star means in trading. Below you can get acquainted with the meaning of this term, the varieties of
candlestick patterns and the features of using patterns in practice.
What is a star pattern in trading
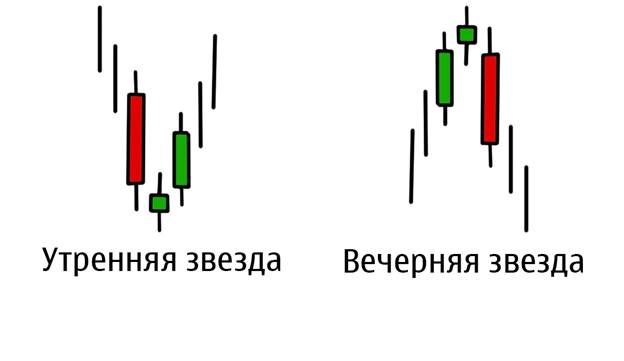
A star in trading is a Japanese candlestick with a small body. This candle displays a price gap with the large body candle that precedes it. In stock markets, the principles of forming a Star on charts for uptrends/downtrends are identical.
Note! Candlestick reversal patterns can give strong signals for close trend reversals in the opposite direction.
The size of the body of the candle is the main identifier of this reversal pattern. It can form both at the bottom of ongoing trends and at their peaks. It is also worth considering that during a downtrend, the candle should be colored in red tones (bearish), and in an uptrend – in a green palette (bullish).

For your information! The entry of other candles into candlestick reversal patterns based on stars allows you to strengthen the signals for a further close trend change in the Forex market.
What types of star pattern are there
Experts distinguish several varieties of patterns, the names of which include stars. Japanese candle happens:
- morning type;
- evening;
- falling.
There is a fourth type, which was called “Three Stars”.
morning star in trading
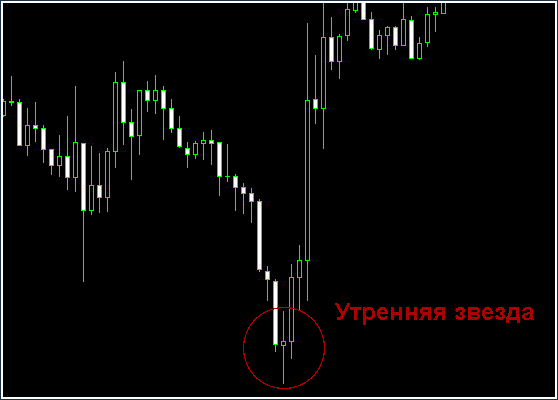
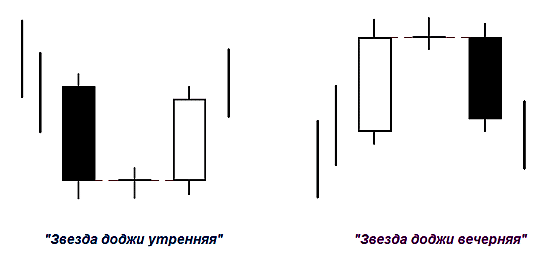
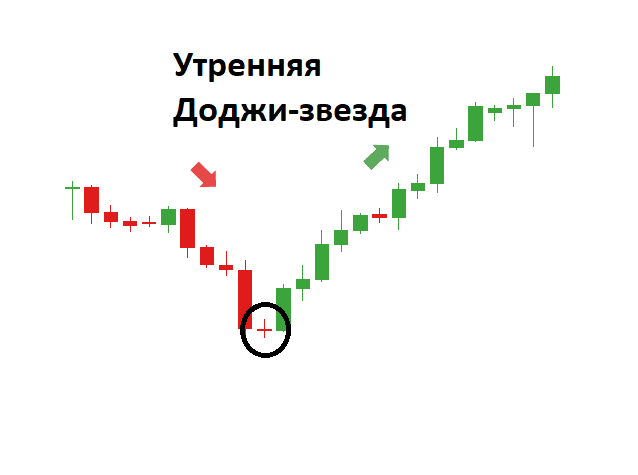
The morning star is a formation of 3 Japanese candlesticks, the nature of which is reversal. Such a candlestick pattern signals that the price movement will be upward. The morning star is a harbinger of rising quotes.
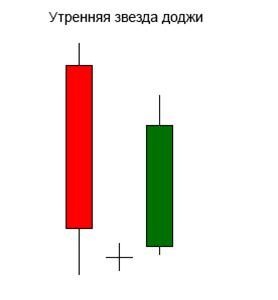
Note! Often, a doji appears in the formation in place of a small 2 candlestick. Similar patterns, called the Morning Star Doji, send stronger signals that the market is about to rise.
When identifying the morning star pattern, you should pay attention to a couple of gaps that are concentrated between the candles. If at least one of them is missing, then the figure ceases to be valid. The formed first candle reflects the advantage of the bears in the market. The presence of the first gap signals that the price is being pushed down by them with great force. The appearance of the next small candle shows the resistance of the bulls that come across on the way. The bears are hit in the small 2 candle due to the significant strength of the bulls that form the next gap. The fact that the bulls, who are striving to gain a foothold in the market, are successful, is evidenced by the appearance of 3 candles.
Evening Star
The pattern, called the morning star, has an inverse twin, which is called the Evening star. The candlestick pattern consists of 3 Japanese candlesticks, the type of which is reversal (the first is light and long, the second is a small any color scheme, and the third is long and dark). Evening star reminds that the downward price movement has been replaced by an upward one. This model is considered a harbinger of price reduction. The formation, which consists of three candles, is divided by 2 gaps. This pattern appears next to significant resistance lines. The signal of the pattern is quite strong.
Evening Star Doji
Evening star Dodge is distinguished by the most reliable signals in comparison with other patterns. The candle that appears first on the chart (colored in a light palette) allows you to know that the bulls in the markets have won, and the resulting gap after it – that the bulls are making efforts to increase the price. The second small candle that is forming next to it reflects the defeat of the bulls that occurs against the background of the formation of a new growth. There is no doubt about the strength of the bears that we met on the way. It turned out to be more impressive, which is why a Gep (gap) appeared in the body of a small candle. The third dark candle that has appeared indicates that the bears have gained a foothold in the market.
Shooting star
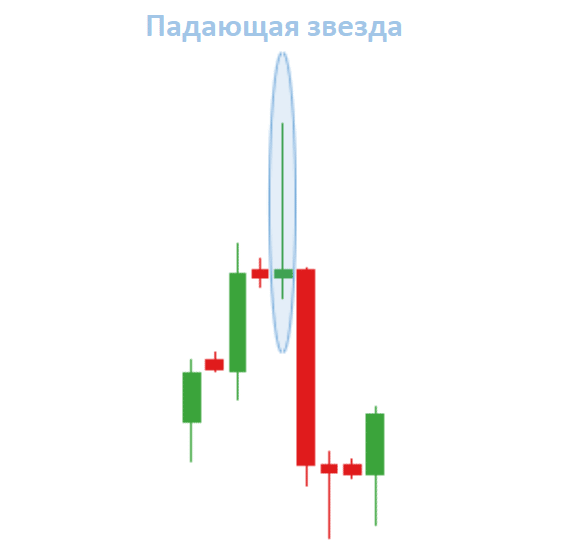
The Shooting Star pattern consists of 1 short candle that appears in an uptrend and warns that a downtrend is about to change. Perhaps the appearance of shadows. The shadow, painted in dark colors, indicates the presence of strong sell signals. A similar pattern appears near resistance levels. It signals that the growth in value is completed. The strength of the bulls, which prevails in the rising market, has led to the fact that the increase in value has reached the resistance level. If traders managed to reach the goal and break through the level, then the pattern will not be formed. In cases where the attempts did not bring the desired result, an elongated candlestick shadow will appear on the screen. The emerging short candle body indicates that the bears are gaining strength.
Three stars
Three stars is the simplest candlestick pattern. 3 doji candles signal that the current trend is changing to the opposite. On the price charts, the pattern is represented as three radiant stars. Between the first two candles is Gep (gap). If the gap is directed downward, then the figure signals an approaching reversal towards the Bulls and vice versa.
Note! Technical analysis indicators are used to confirm the reliability of the model.
The price movement noticeably weakens after the first doji appears. The presence of a gap in the direction of the trend indicates that attempts have been made to prolong the trend. The appearance of the 2nd doji indicates the true weakness of the trend, which is fading away. The third one signals that the price is changing. The trend has finally exhausted itself. It is worth remembering that this pattern signal is rather weak.
How to use the star candle in practice in trading
Each trader should know the features of trading with candlestick patterns, including those patterns that contain Stars. It is worth remembering that the appearance of the Morning star pattern on the chart should encourage the trader to start considering the possibility of opening long positions. The pattern is often used as an independent strategy. The formation pleases with strong signals. It is allowed to work exclusively on them, but experts still argue that it is advisable to combine the analysis of the figure with an assessment of trade volumes.
Note! Traders advise trading on timeframes from 30 min. and more.
Strengthening of the signals of the pattern is facilitated by the presence of:
- 3 candles with an elongated body;
- large gaps between candles;
- overlapping the body of the 1st candle with the body of the 3rd candle;
- a decrease in trading volumes during the formation of 1 candle and a further increase in volumes at the moment when 3 candles open;
- the bodies of the second candle are doji/stars of a light shade.
When the pattern is fully formed during the opening period of the next candle, the market is entered. In the process of trading, profit is fixed by setting TakeProfit at a distance of 10 lines from the last maximum, regardless of direction. StopLoss is set to limit losses. According to Evening star signals, trading recommendations will be similar, however, positions will start to open in the opposite direction. Factors that enhance the reliability of the pattern have opposite meanings. As soon as the Evening Star appears on the chart, the trading specialist considers as much as possible to open a short position. The signals of this model are quite strong, so it is possible to use the pattern as an independent trading strategy. The presence of:
- body of the 2nd doji/star candle, painted in dark colors;
- gaps between candles;
- elongated body at the last candle.
The strengthening of the formation, which heralds the onset of a bearish trend, will be facilitated by a candle of a dark shade. When the Evening star pattern appears, positions are closed in the same way as in the case of trading with the Morning Star. The market entry tactics are similar. In this case, the price movement should have a downward character. Morning and evening star in trading: https://youtu.be/hr_H4sqFxHQ
Problems and errors in application
It is not uncommon for traders to make mistakes when applying patterns containing stars. The most common mistakes include:
- Opening positions on the 2nd or 3rd candle, which was not fully formed.
- Using timeframes below 30 minutes.
- No set take profit/stop loss after entering the sale.
- Making a purchase when the Evening star pattern appears on the chart. Having found such a candlestick pattern on the chart, it is advisable to prepare for a sale.

Important! When evaluating patterns, don’t forget about gaps.
To succeed in trading, specialists must master the tactics of trading on technical analysis. It is important to get acquainted not only with the meaning of terms, varieties of candlestick patterns, but also thoroughly study the features of using patterns in practice, including those in the name of which a star appears. This is the only way to succeed in trading.

