
The Price Channel indicator was invented by an American businessman R. Donchyan more than 40 years ago. Traders consider it a reliable tool, the signals of which are taken into account by the classic price channel strategy. Combined with indicators of trend strength and sales volume, it can be highly effective. 
- What is the Price Channel indicator
- Indicator calculation formula
- Pros and cons of using the Donchian Channel indicator
- basic settings
- Trading strategies based on Price Channel Indicator
- When to use the indicator
- Trading by price channels in popular terminals – how to use the Price Channel
- Price Channel Indicator for MT4
- Setting up a price channel in Quik
What is the Price Channel indicator
The Price Channel Indicator (PC), or the price channel indicator (Price Channel), is a kind of Envelope that determines the oversold or overbought areas of an asset.
A price channel in trading is a “corridor” within which the price is constantly moving. Its boundaries are delineated by lines of support and resistance.
The PC indicator limits the selected price range by lines reflecting the local maximum and minimum prices for the selected interval. Also, within the channel, a central axis is formed, indicating the general direction of movement. Price Channel Indicator performs 2 functions:
- shows the direction of the trend;
- signals about price breakouts through the upper or lower boundaries.
Indicator calculation formula
When plotting the boundaries of the price channel, the Price Channel Indicator takes into account the latest local highs and lows for the n-period.
The upper limit reflects the highest price for the selected interval:
Price_Channel_Upper = Max(PriceHigh(n))
The lower limit shows the minimum asset price for the same time period:
Price_Channel_Lower = Min(PriceLow(n));
The central line is the arithmetic mean between the values of the upper and lower limits (not calculated for all versions of Price Channel):
Price_Channel_Middle= (Price_Channel_Upper+Price_Channel_Lower)/2)As long as the extremum is relevant within the selected time range, horizontal base lines are formed. When it changes, the chart is rebuilt relative to the new high or low. 

Pros and cons of using the Donchian Channel indicator
PC is considered to be an effective indicator, the use of which provides several advantages:
- fast construction of price channel boundaries for different periods of time;
- the ability to see the direction of the trend;
- display of flat sections.
Unlike the moving averages used by most trend indicators, PC baselines do not account for small fluctuations. This is also a significant plus, because. distractions to insignificant deviations lead to a waste of time, and in the worst case, to incorrect conclusions. The only significant drawback of the indicator is the rapid adjustment of the baselines, which often makes it difficult to predict breakouts in a timely manner. However, this problem can be effectively solved using additional tools: indicators of volatility, trend strength, vertical volumes. For example, Trading Price Channel Algorithm Vertical Volume shows good results. Vertical volume data, combined with price action, can effectively predict trend changes. For example, if both indicators increase, then with a high degree of probability the uptrend will continue. On the contrary, a decrease in volumes and prices predicts a downward trend.
basic settings
When setting up the instrument, only one parameter is used – the number of time periods (candlesticks) for which the extremum is taken into account. The value of 14 is traditionally assigned, but it is changed depending on the selected timeframe. On a short period, the chart is rebuilt too often, on a long period – slowly, ignoring new levels inside the price channel. Experienced traders often overlay several price channels on one chart with different periods. This allows for better predictions. However, this tactic is not suitable for beginners who can easily get confused when receiving a large number of signals and make inefficient trading decisions. 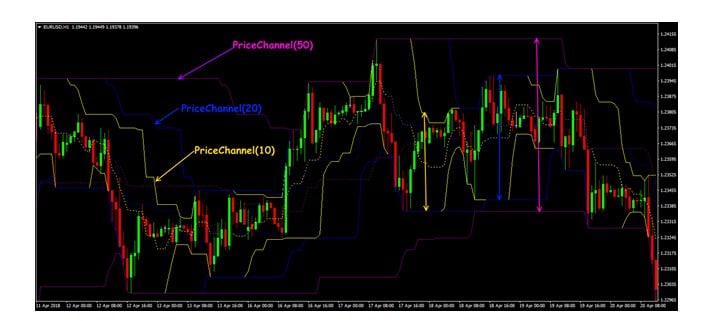
Trading strategies based on Price Channel Indicator
Classic Price Channel trading uses 2 main methods: work within the price range and operations when levels are broken. Within the framework of these approaches, there are 4 basic rules that dictate the execution of certain operations when the corresponding signals appear.
| Operation | Signal to take action |
| Purchase | The price closes above the upper level with a period of 20 |
| Sale | The price breaks the lower border with a period of 20 |
| Closing long (long) positions | The lower boundary was rebuilt after the fifth period |
| Closing short (short) positions | The upper boundary was rebuilt after the fifth period |
The classic Price Channel strategy involves opening a trade at the opening of the third candle following the 2 previous ones that closed behind the central axis. At the same time, Stop Loss is set to the level corresponding to the minimum price of the candle that first broke through the middle line.


Fibonacci: reversal system
When to use the indicator
Trading through price channels, incl. using a PC-indicator, can be carried out in any markets, regardless of the urgency of operations. It is often used as a technical basis for various trading systems: both trend and counter-trend.
Trading by price channels in popular terminals – how to use the Price Channel
A price channel is an indicator that can be used in any trading terminal. In each software package, its configuration is intuitive and simple. You need to download the Price Channel indicator in advance, because. it is not included in the standard package of most interfaces.
Price Channel Indicator for MT4
The MetaTrader software package is the most popular among traders. It allows you to install and configure your PC in just a few minutes.

of the trading terminaland select the sub-item “Open data directory”. In the window that appears, go to the “MQL4” folder, then to “Indicators”, where the indicator installation file is copied. Find the “Indicators” folder in the terminal’s navigator. Click on it with the right mouse button and select the update item. Then find the Price Channel in the catalog list and open it by double-clicking the left mouse button. The preset window will appear. In the “General” tab, be sure to check the box next to the “Allow DLL import” item.


Setting up a price channel in Quik
The Quik program is also popular and is used by many large brokers. Dealing with installing a PC within the terminal is as easy as using MetaTrader.

The Quik
and needs to be adjusted. To do this, double-click the left mouse button in the chart area, in the window that opens, select the item with the name of the financial instrument for which the price channel is formed. In the example above, it’s a string called “IMOEX (Price Channel)”.


