The Alligator indicator by Bill Williams in trading, how to use it, how it works, the trading strategy, how it looks on the chart.
- What is the Alligator indicator by Bill Williams and what is the meaning, calculation formula
- Views and construction, as well as recognition on the chart
- How to use the Bill Williams Alligator, setup, trading strategies
- When to use, on which instruments, and vice versa, when not to use
- Pros and cons
- Application in different terminals
What is the Alligator indicator by Bill Williams and what is the meaning, calculation formula
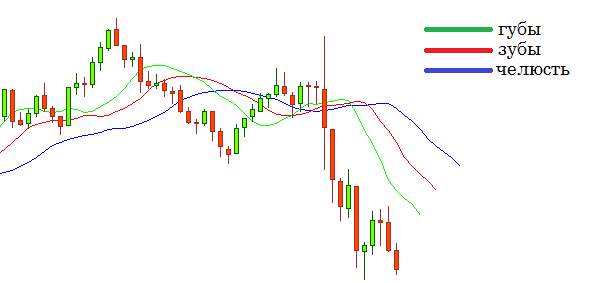
This indicator can be used as the basis for a trading strategy. It was invented by the famous trader Bill Williams. It consists of three lines, from the behavior of which in different parts of the chart it got its name. In a calm market, they are located next to each other, but when there is a trend, the distance increases, which in some ways resembles how the navigator opens its mouth, preparing to eat. Each of his lines has received a name that is related to this image.
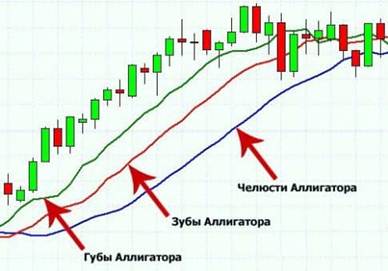
- The slowest one is usually blue. When calculating here, data for 13 bars are taken. Then this curve is shifted forward by 8 bars.
- The average takes into account data on 8 bars. It is shifted 5 bars forward. This line is marked in red.
- The fastest moving average is green. Its period is 5 and its shift is 3.
The slow average is called “Alligator Jaw”. It indicates the direction of the trend. Knowing it, a trader can get an important filter for getting trade entry points. Medium (“Alligator’s Teeth”) and fast (“Alligator’s Lips”) show the features of a short-term situation that will help you make the right decision on entering a trade.
Views and construction, as well as recognition on the chart
The indicator consists of three moving averages with different periods and shifts. The slowest of them will show the trader the main trend in the movement of quotes. The middle and fast lines will help you find a profitable trade entry point. Many people use this indicator with standard settings. In this form, over the years, it has shown its effectiveness. However, experienced traders can choose parameters that will better suit the instruments used. When setting up, they can use different types of averages. For processing, not only the average values of the bars, but also some other characteristics of them can be used.
How to use the Bill Williams Alligator, setup, trading strategies
As you know, the market can be in different phases. In this case, it is necessary to take into account not only the presence or absence of a trend, but also the stage of its development. Using the Alligator, the following situations can be distinguished:
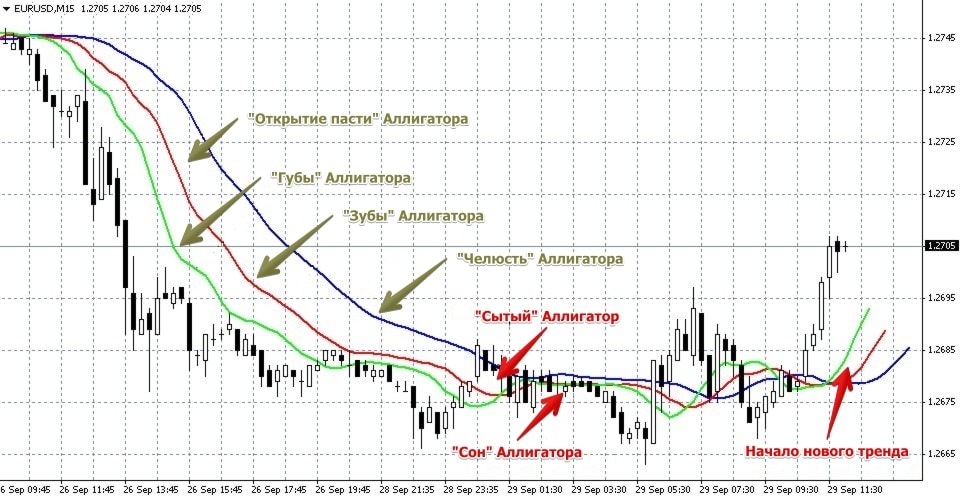
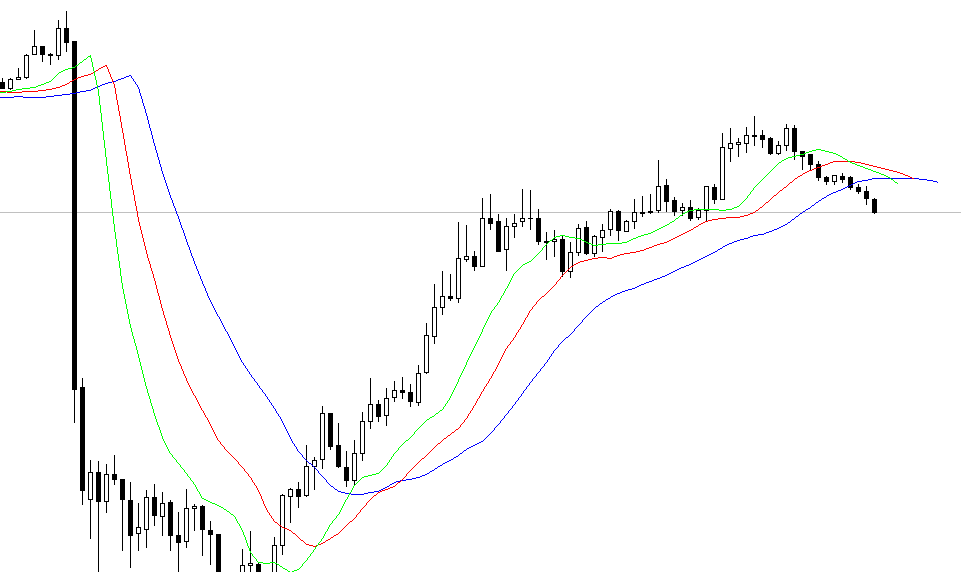
- When the market is in a flat state , the curves that enter the indicator in question are located close to each other. At this time, there are no noticeable changes with each of the averages used. At this time, you should not count on entering a profitable deal.
- The middle ones start to diverge . First of all, the gap between the fast and middle lines is growing. Slow starts to react a little later. You don’t have to react right after that. This style of trading is only suitable for those who like high risk trading. For the rest, it is more profitable to wait until further confirmation is received. If the alligator opens up, then this one indicates the possible beginning of a growing trend, if it opens down, then we are talking about a decreasing one.
- All three lines noticeably diverge . At this time, we can talk about the presence of a confident movement. Now is a good time to enter a trade in line with the direction of the strong trend. It is expected that in the future the direction of price movement will continue.
- The final stage of a trend occurs when it begins to lose momentum . At this time, the averages begin to gradually approach and intertwine with each other.

When to use, on which instruments, and vice versa, when not to use
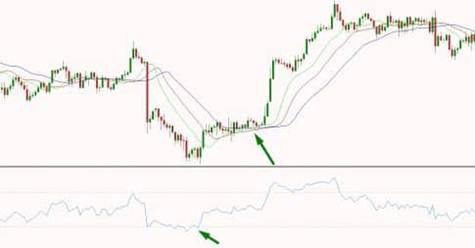
The Alligator indicator is beneficial to use for entering trades following the trend. At a time when there is a side trend, its use will be ineffective. When working with a certain instrument, a trader does not have to use the classic set of parameters. He can change them so as to take into account the peculiarities of the quotes chart. It is important to note that when this indicator is used in conjunction with others, its effectiveness will be much higher. One such example is the use of the Alligator in conjunction with the
RSI .
Stochastic . https://articles.opexflow.com/analysis-methods-and-tools/stochastic-oscillator.htm Alligator indicator by Bill Williams – how to use, trading strategy: https://youtu.be/PQna5hLgurs
Pros and cons
An important advantage of the Alligator indicator is its consistency. When building a trading system, it can be used for various purposes, which includes determining the presence and strength of a trend, as well as choosing entry and exit points for a trade. This indicator works well on trending movements. Its effectiveness can be increased if used in conjunction with others. This will increase the likelihood of successful use of the transaction. The use of this indicator is possible both in the classic version and with adjustments made by the trader. The effectiveness of the application depends on how thoughtfully the settings were changed. Alligator has a simple and understandable usage logic. It is suitable not only for experienced traders, but also for beginners. The disadvantage of the Alligator is its inefficiency in the presence of a sideways trend on the chart.
Application in different terminals
The considered indicator is usually one of the standard ones for all the most common terminals. The procedure for its installation on the chart can be considered using the Metatrader program as an example. To do this, you need to do the following:
- First, you need to select the instrument with which you plan to work with the indicator in question.
- Then, in the main menu, which is located at the top of the screen, select the “Insert” section.
- Select “Indicators” from the submenu. Then, in the list that opens, click on the line “Bill Williams”.
- Now you need to click on the line “Alligator”.
This will open the options window. There are three tabs here. On the first of them, “Parameters” indicate the data for configuration. Here you can specify the appropriate parameters for each of the middle lines used:
- For them, indicate the period and the magnitude of the chart shift.
- You can choose how to average the data. Four options are available for this: simple average, exponential, linear weighted, or smoothed.
- Although in the classic version, the work is done with the average values of the bars, nevertheless, the trader is given the opportunity to choose their other characteristics as well.
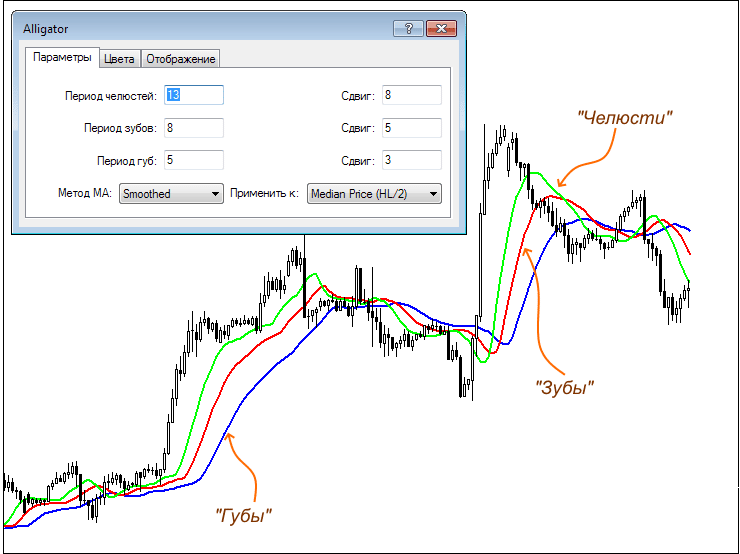
- The average value obtained by dividing the sum of the bar’s high and low by 2 (also called the median price).
- Opening price.
- Closing price.
- Maximum value.
- Minimum value.
- The typical price is calculated as follows. First you need to add the closing price with the minimum and maximum. Then divide the result by 3.
- To calculate the weighted price, add the minimum and maximum prices, and add the closing price twice. The result is divided by 4.
On the “Colors” tab, you can choose what type and color of each line will be used. Here the trader can make settings if he wants to change the appearance of the indicator. The “Display” tab indicates in which timeframes the chart should be displayed. To do this, you need to put the birds in the appropriate lines.
