
Technical analysis largely depends on the exact determination of the direction of price movement, the construction of important levels and indicator readings. It is also very important how the price chart is displayed. The article describes in detail the Heiken Ashi indicator as a tool for visually determining the direction of the market. Additionally, the formula for calculating the Heiken Ashi indicator, the most profitable strategies based on it, is given.

Heiken Ashi indicator – basics for beginners
This tool is visually very similar to a regular chart that displays prices using
Japanese candlesticks . The main difference from Japanese candlesticks is the smoothed display of price fluctuations. Heiken Ashi is also built in the form of candles, but with some slowdown. It is the slowdown that makes candles the most informative.

The principle of operation and calculation of Heiken Ashi
When using conventional Japanese candlesticks, the trader is faced with the problem of market noise. This is a lot of impulse fluctuations that do not carry useful information, but they significantly interfere with determining the most advantageous point for entering the market. The Heiken Ashi indicator smooths out the market noise as much as possible by lining up only candles with useful volume. The construction of each candle of this indicator is based on 4 main elements:
- Open level is taken into account.
- The level of subsequent closing (Close).
- Price maximum (High).
- Price minimum (Low).

- The opening price, or ha Open, is calculated from the sum of the opening and closing of the previous bar, divided by 2- (ha open+ha close)/2 .
- The closing price is calculated from the sum of the open, high, low and close prices divided by 4 – (open+high+Low+Close)/4 .
- The maximum of the candle is calculated by the value of the maximum price by opening and closing ha High=max (Open, Close, High).
- The low is the product of the low open and close low ha Low=min (Open, Close, Low).

Rules of use – strategies based on Heiken Ashi
To effectively use the Heiken Ashi indicator, there are some rules to consider. The main ones are the following:
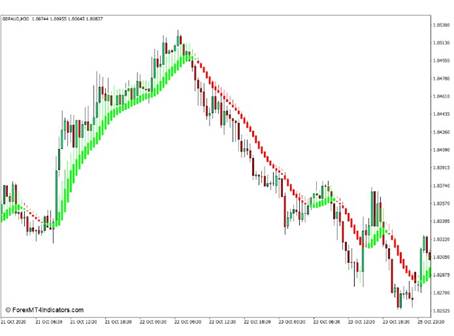
- Often in terminals, for example, MT4, this indicator is superimposed on top of the main price display candles. In this case, it is worth minimizing the display of Japanese candlesticks. This is done by simply changing the color from basic to white.
- This indicator is most informative on highly volatile currency pairs. It is worth remembering that the faster the market, the less price noise is present in it, which means that it contains more useful information.
- The indicator is used only for trend trading. This tool reflects the direction of the market very well.
- Candle shadows. It is necessary to accurately monitor the number of candlestick shadows and bodies. If only candlestick bodies dominate on the chart, this indicates the strength of the current market participants. The predominance of shadows indicates the appearance of weakness, which means a decrease in volume.
- The tool shows efficiency on timeframes from H30 and higher. Lower timeframes contain a lot of market noise and uncertainty.
It is also worth considering that you can start trading using this indicator only after the appearance of 3 candles of the same direction.
Heikin-Ashi candle indicator, Heikin-Ashi strategy for beginners: https://youtu.be/ulSacgwzLmk
Setting
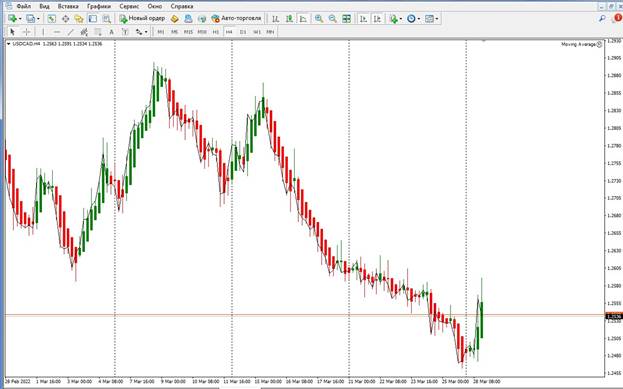
Before using the Heiken Ashi indicator, it must be properly configured. On the MT4 platform, this is done as follows.
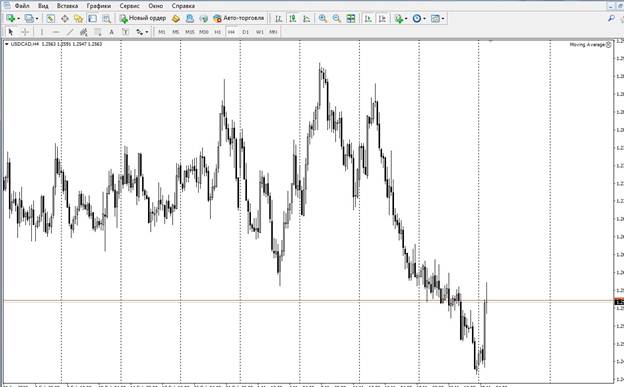
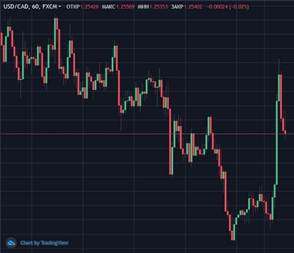
- Open a chart of a highly volatile currency pair, such as USD/CAD.
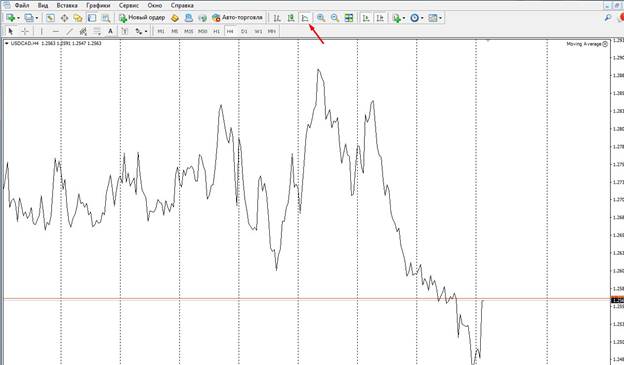
- Select the linear display of the graph in the top settings panel.
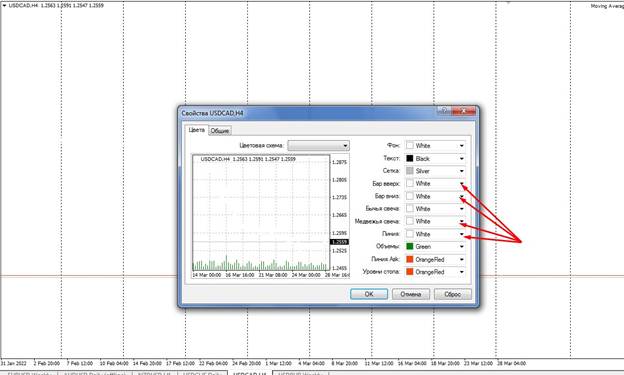
- Go to chart properties and change the current display line color to match the screen color. For example, if a line is displayed in black on a white background, it must also be made white. Thus, it will be possible to completely hide the price display line.
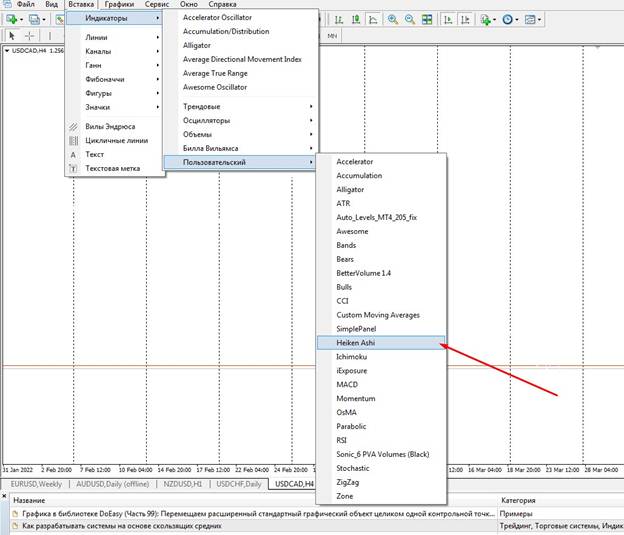
- Next, you need to perform the transition “Insert” – “Indicators” – “Custom” – “Heiken Ashi” and click on the name of the indicator.
- Next, the window for setting the indicator parameters will appear, in which you will need the “Input parameters” section.
- In this section, you need to change the display colors of “Shadow of bull candlestick” and “Bull candlestick body” from white to green.
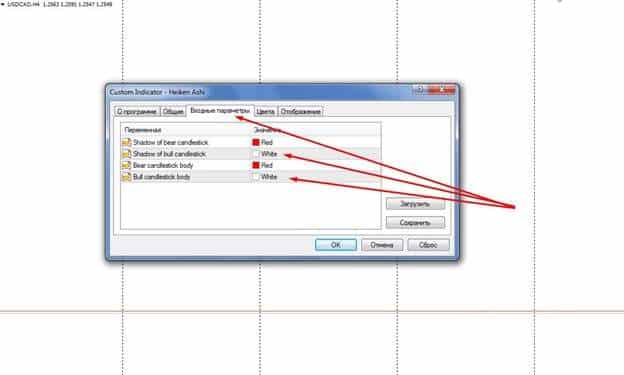
- Save settings.


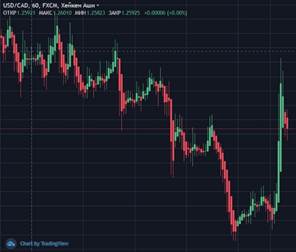
Everything, the indicator is fully configured. If you are using a TradingView-based terminal, you just need to go to the chart display selection and select the Heiken Ashi option. Additional settings are no longer required.
Practical use of Heiken Ashi – how to use the indicator
In trading, you can use the Heiken Ashi indicator as the main instrument or paired with an additional indicator. Next, consider the 2 most effective strategies.
Strategy 1
This trading system is based on the search for an entry point, at the moment of a change in the direction of the trend or after the end of the corrective movement within the trend:
- First you need to put the Heiken Ashi indicator on the chart.
- Next, you should choose a timeframe with the most clear direction of price movement. It is necessary to take into account that the direction on lower timeframes coincides with higher timeframes. For example, H30, H1, H4 direction – downtrend.
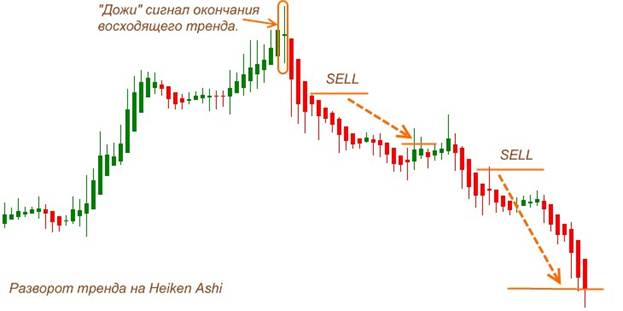
- Next, you need to wait for a trend change. This will be indicated by the appearance of a Doji uncertainty candle or an increase in the number of high shadows.
- A change in the trend from an uptrend to a downtrend will also be indicated by the appearance of descending red candles.
- After the appearance of 3 such candles, you need to enter the market for a fall.
- Stop-loss set at the closing level of the first descending candle.
- Take profit is set near an important level.

This strategy is the simplest and requires maximum concentration. Its only disadvantage is the need to constantly accompany the trend, with the possibility of closing a position at any time.
Strategy 2
This strategy uses the Stohastic oscillator with standard settings as an additional tool:
- Apply the Heiken Ashi indicator to the chart.
- Install the Stohastic Oscillator.
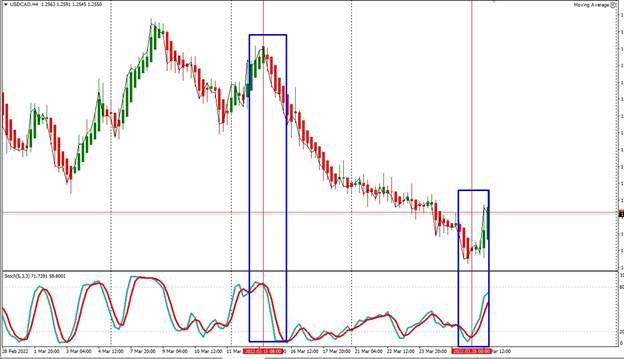
- Wait for a change in direction.

When the trend direction changes, the color of the Heiken Ashi candles will change from green to red (beginning of a downtrend). At the same time, the lines of the Stohastic oscillator will be in the ascending zone 20, in the process of crossing. A sell trade should be opened after the third down candle appears. In this case, the stop-loss level is set next to the closing price of the first descending candle.
Mistakes and risks
It has already been said in which markets it is worth using the Heiken Ashi indicator, which time periods of the chart should be taken into account. Now let’s talk about risks.
- The indicator is not used for fast scalping on M1, M5, M15 segments.
- There is also a great risk of trading pullbacks within a trend.
- It is forbidden to trade, according to this indicator, at the time of lateral price movements.
- It is forbidden to trade assets with a low movement speed. For example, gold, crypto currencies, raw materials.
Also, a trader should take into account that the best confirmation of a trend change is when the price is near an important level and changes direction within 2-4 candles.
Pros and cons
The Heiken Ashi tool has a number of advantages and disadvantages. Among the advantages can be identified:
- Smoother graph readings.
- Visual ease of determining the direction of the trend.
- Compatibility of readings with many trend indicators and oscillators.
Among the shortcomings of the indicator, one can single out only the delay in the indications of the current market situation. Also, this indicator and the chart built on its basis have a low number of informative patterns indicating a trend change.
Application in trading terminals
Various trading platforms allow you to set Heiken Ashi as an indicator, the main chart display method, or as a “heiken ashi smoothed” oscillator.
- In the MT4 terminal, the indicator must be applied to the chart, using it as a visual aid to determine the direction of the trend.
- When using the heiken ashi smoothed oscillator, it is also superimposed on the chart, but differs in that it builds its direction according to the moving average principle.
- On the “TradingView” platforms, you can customize the display of the entire chart based on Heiken Ashi. At the same time, the instrument fully displays the direction of the price, no longer being an indicator.


Regardless of the type, Heiken Ashi continues to smooth out market noise, helping to determine the direction of the trend. The Heiken Ashi technical analysis tool allows traders, regardless of their level, to identify more accurate market spikes and directions. This indicator will help to identify the most accurate point to enter the market, reducing the risk and rate of erroneous trades.

